Simulated latency and the latency on the real hardware extremely different

Hi Everyone,
I use the model for MNIST dataset,
the project is configured according to this instruction:

and according to EI I should get the following results:

But my real result on the STM32F767 is (Debug):
real_results
Release mode:
real_results_release

my chips is running on MAX speed:

Is it expected to have the simulated value 39 ms, but the real 3090/535 ms?

maybe there is some setting I should apply to my project?

1 Like

Hi @enko

Welcome to the forum!

Excellent analysis! Let me pass this on to the embedded team and see if they can take your observations into account to help get some improvements on those estimations for this target.

  1. Simulation Accuracy vs hardware in the loop: The simulation might not accurately reflect the real-world conditions of the hardware. We offer hardware in the loop testing for other vendor targets to cross validate against but not this one yet so the estimations may well be different but again model complexity is something that can be at play here too. Not long ago this type of operation was not able to run on anything below SBCs.
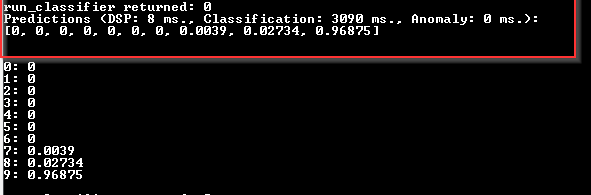
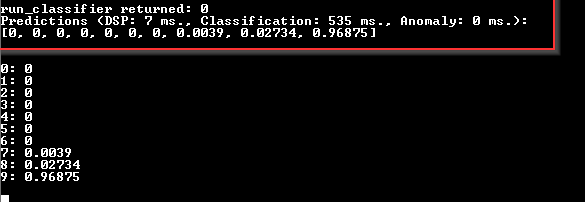
  2. Model Complexity: The MNIST model might be too complex for the hardware, leading to longer inference times. This could be a result of the model architecture, the size of the model, or the efficiency of the model’s operations. Again we can only give estimations based on simulated architecture for this device that dont factor in unanticipated hardware specific bottlenecks.
  3. Debug vs Release Mode: Running in debug mode often adds additional overhead due to logging, monitoring, and other debug-related tasks. Further more we have additional latency to consider if you are using via cli.

There are other conversations on this topic in the forum too, please feel free to pick up on one of those that the embedded folks have been discussing on too.

Best

Eoin

1 Like

Hi @enko

Can you please share the Project ID, and the IDE version that you are using / compiler, OS and any other details you have. So we can reproduce your environment. Thanks!

Best

Eoin

Hi Eoin,

thanks for the answers.

Project ID 319646
STM32CubeIDE: 1.14.1
OS: Windows 10 x64
Compiler: Default GCC that is part of STM32CubeIDE
Kit: NUCLEO-F767ZI

EI Inference code

void run()
{
    ei_impulse_result_t result = { 0 };

    signal_t signal;
	signal.total_length = sizeof(features) / sizeof(features[0]);
	signal.get_data = &get_feature_data;

    //EI_IMPULSE_ERROR res = run_classifier(&signal, &result, true);
    EI_IMPULSE_ERROR res = run_classifier(&signal, &result, false); //disable debug
	ei_printf("run_classifier returned: %d\r\n", res);

	ei_printf("Predictions (DSP: %d ms., Classification: %d ms., Anomaly: %d ms.): \r\n",
	result.timing.dsp, result.timing.classification, result.timing.anomaly);

	// print the predictions
    ei_printf("[");
	for (size_t ix = 0; ix < EI_CLASSIFIER_LABEL_COUNT; ix++) {
	    	  ei_printf_float(result.classification[ix].value);
	  #if EI_CLASSIFIER_HAS_ANOMALY == 1
	          ei_printf(", ");
	  #else
	          if (ix != EI_CLASSIFIER_LABEL_COUNT - 1) {
	              ei_printf(", ");
	          }
	  #endif
	      }
	  #if EI_CLASSIFIER_HAS_ANOMALY == 1
	      ei_printf_float(result.anomaly);
	  #endif
	      ei_printf("]\r\n\n\n");

	  // human-readable predictions
	  for (size_t ix = 0; ix < EI_CLASSIFIER_LABEL_COUNT; ix++) {
	      //ei_printf("    %s: %.5f\r\n", result.classification[ix].label, result.classification[ix].value);
	      ei_printf("%s: ", result.classification[ix].label);
	      ei_printf_float(result.classification[ix].value);
	      ei_printf("\r\n");
	  }
	  ei_printf("\r\n");

      HAL_Delay(5000);
}

Thanks

1 Like

Hi @Eoin,
I got some updates:

Enabled I/D cache, it decreased dps/inference time: 2ms/143 ms
cache

1 Like

Great thanks @enko!

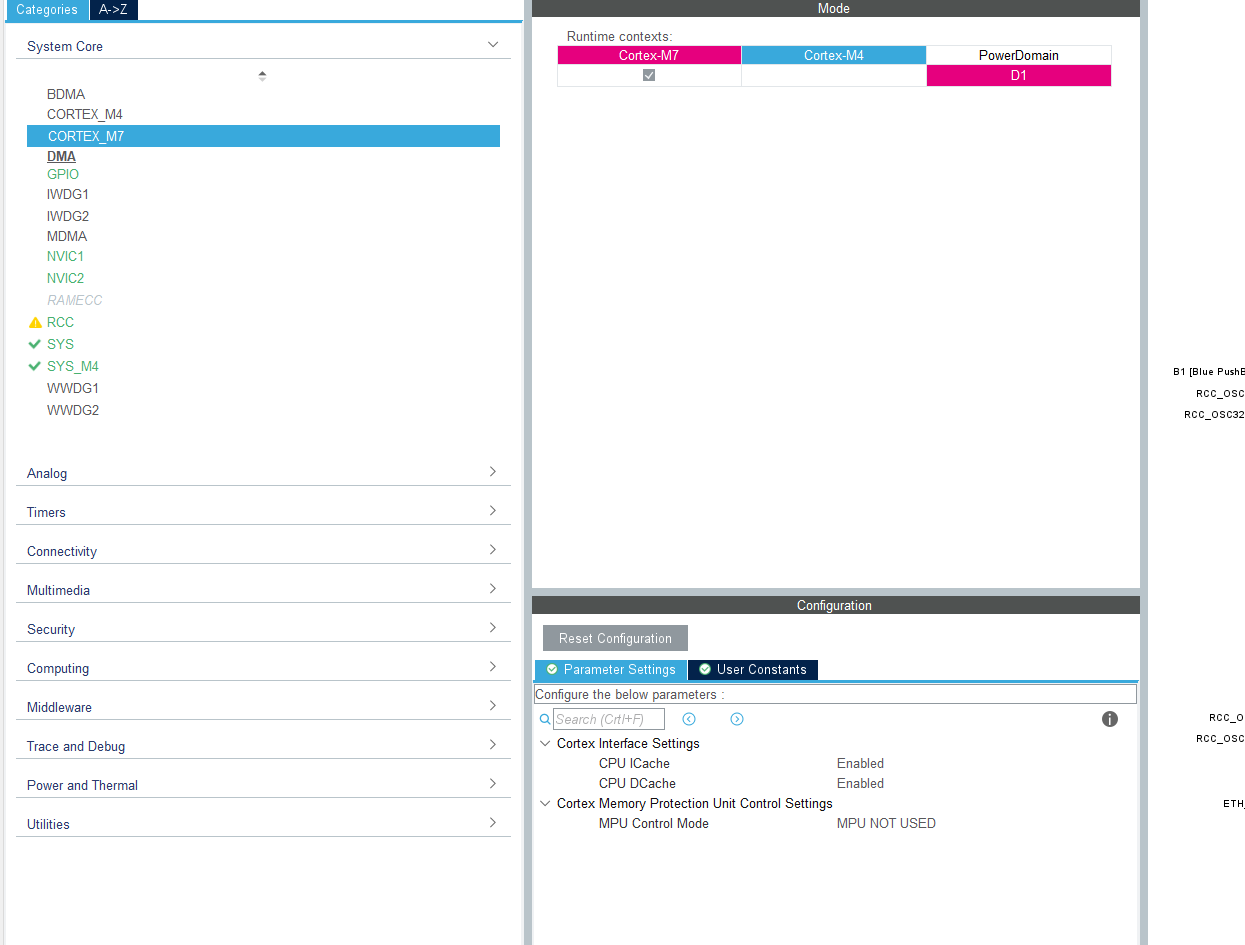
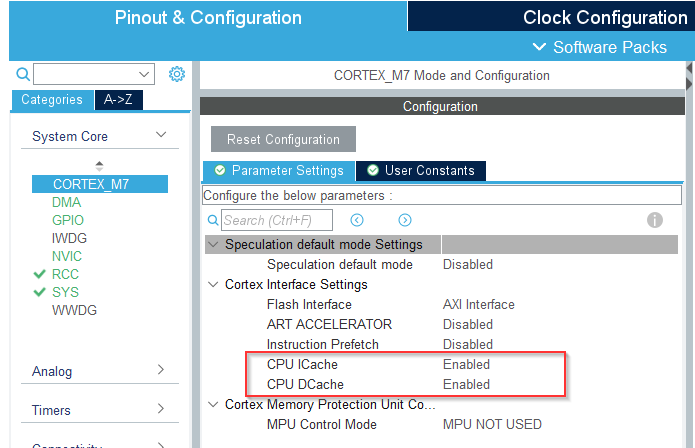
OK great so i-cache d-cache sounds like hardware specific, let me check with embedded, and capture in the issue. Hopefully this is something we can set by default @AlexE @mateusz FYI

@enko

Perhaps for now updating the docs to detail that users should disable these settings would help get more true to estimation results?

We will post here once we get time with holidays and ongoing tasks in motion. Thanks again for all of this analysis super valuable to have this insight from embedded developers! Feel free to keep this thread open for now.

Best

Eoin

Hi @Eoin ,
thanks for the post.

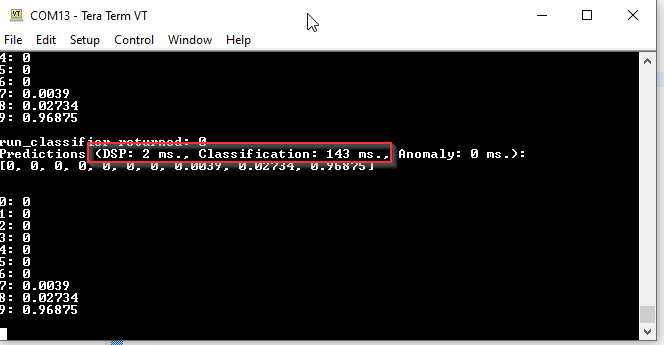
These settings are disabled by default, so users need to enable them to get better results.
This allows the CPU to work more efficiently with MCU memory.

my current settings:

another possible optimization (I’ve not tried it yet, just an assumption) is to put tensor arena into Core-Coupled-Memory (CCM) , example:

1 Like

Ah great ok I’ll add that to our docs, thanks for the heads up @enko!

Best

Eoin