I assume that dark blue is low energy and yellow - red indicates high energy.
So I have difficulties mapping both MEL spectograms to each other.
More particular:
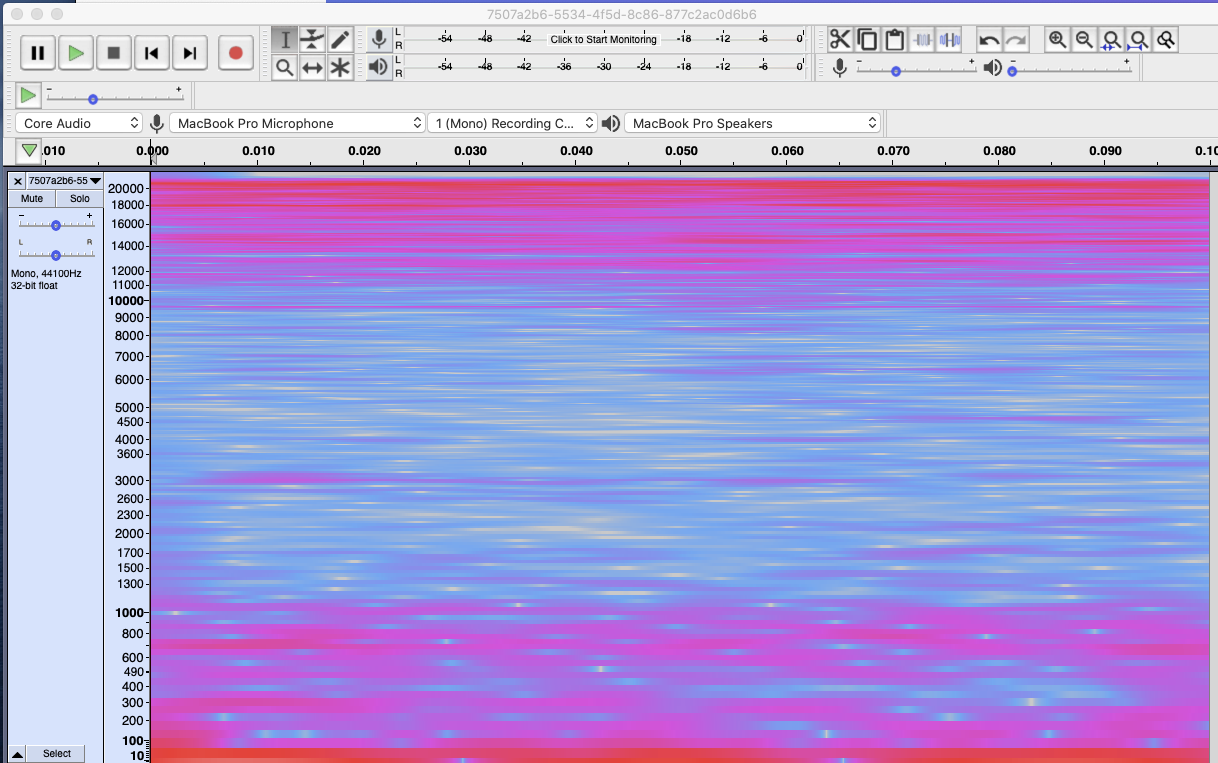
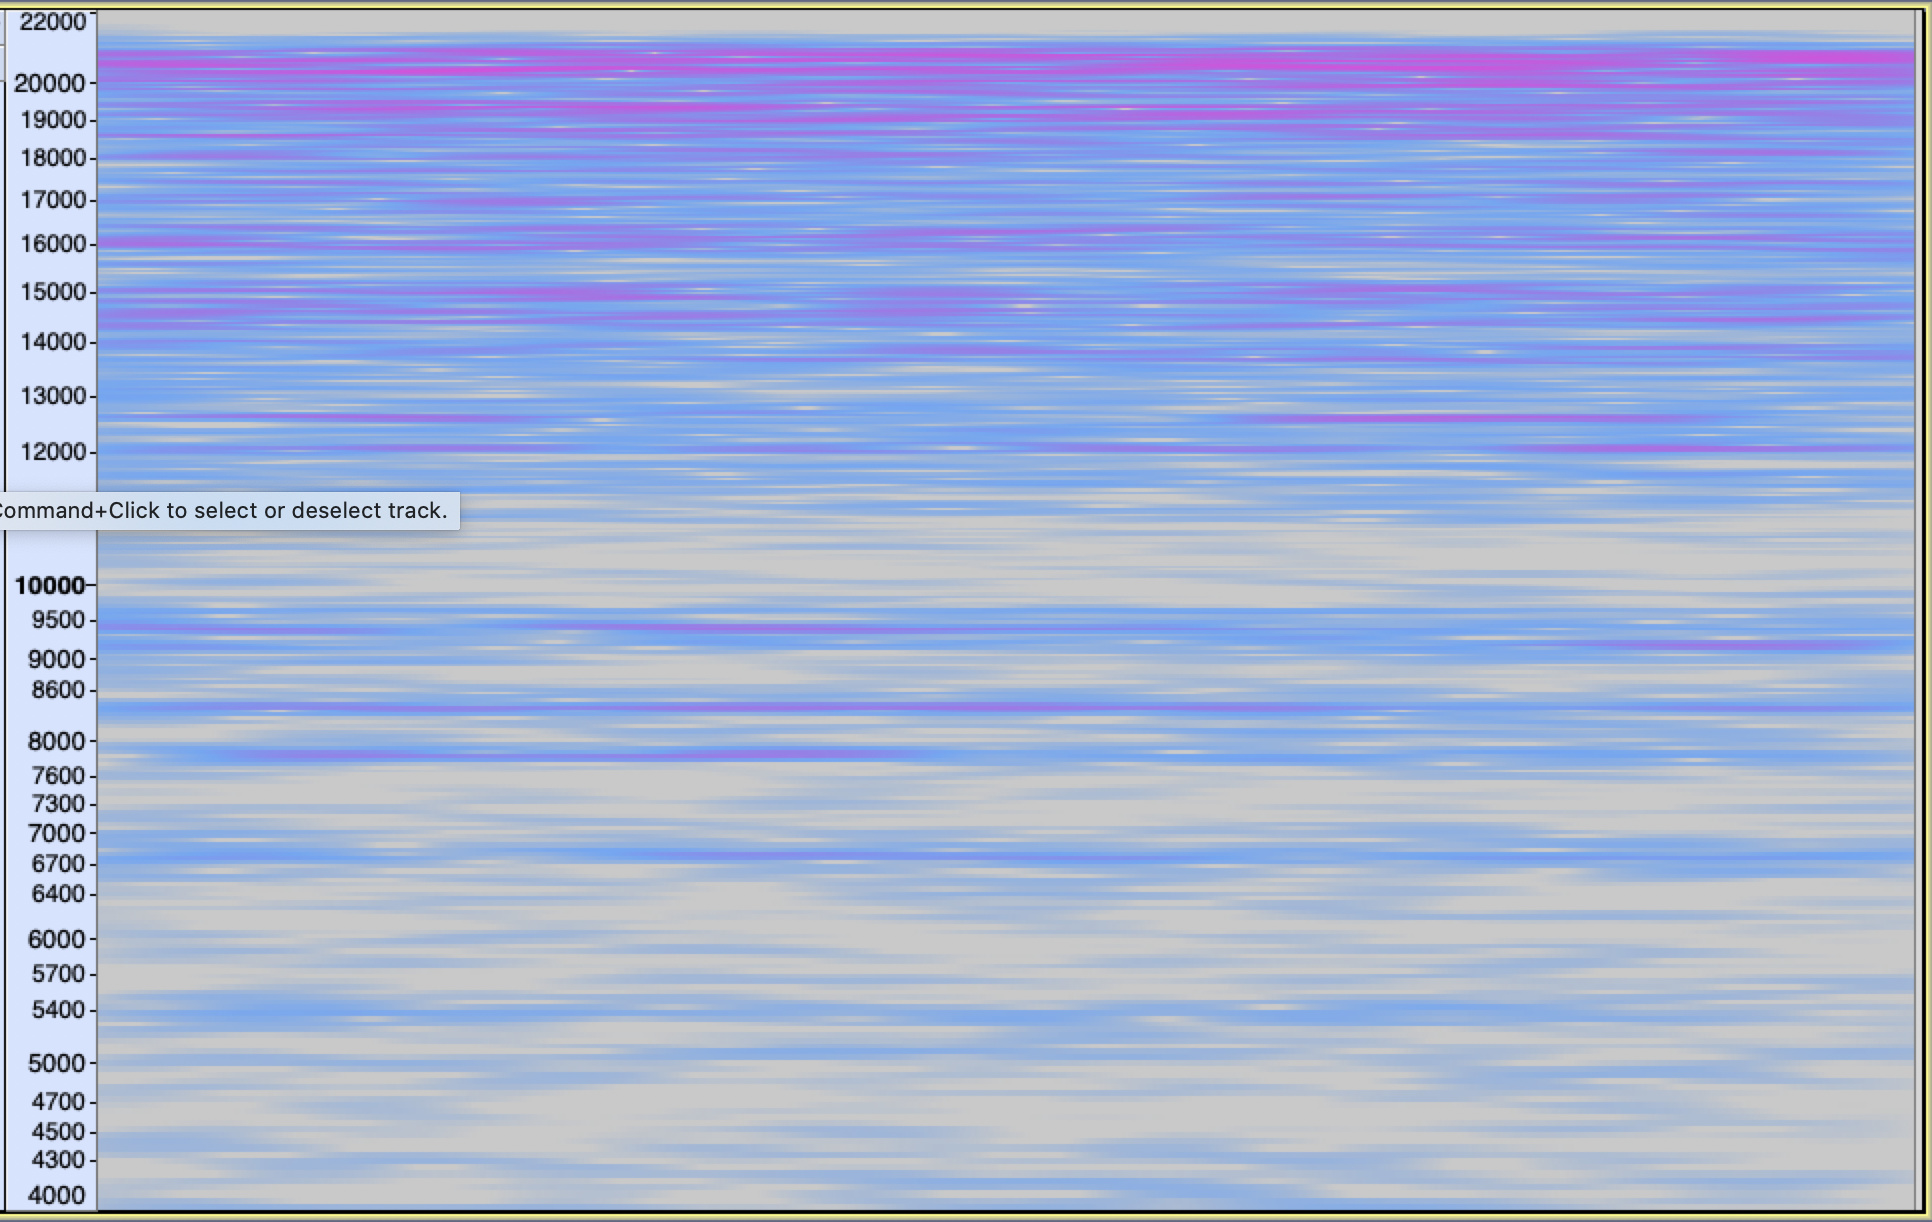
What is the frequency scale (In audacity it goes from 1 to 22050 Hz) ?
In audacity spectogram I see a lot of energy in the low frequencies (< 1300 Hz) and in the high frequencies (> 11000 Hz) which I don’t see see in the edge impulse studio spectogram.
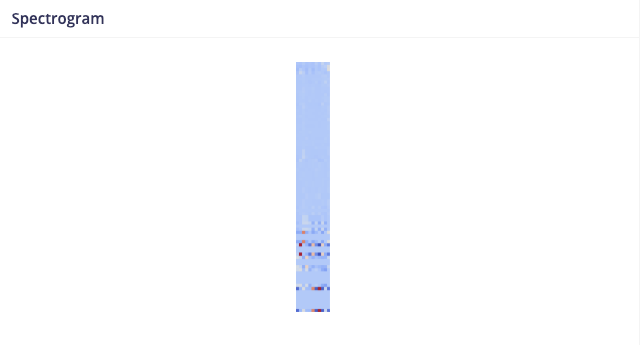
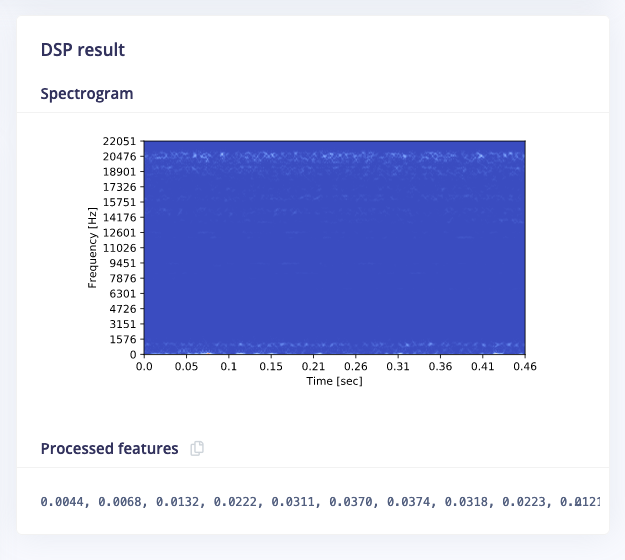
The edge impulse studio spectogram shows some bands but it is unclear for which frequency ranges.
The edge impulse studio spectogram shows small bands with some dark blue color periods. I am assuming that dark blue means that there is not much energy which is the opposite of what I see in audacity spectogram (the red bands around 6800 Hz, 7800 Hz, 8300 Hz and 9500 Hz have more energy than outside it).
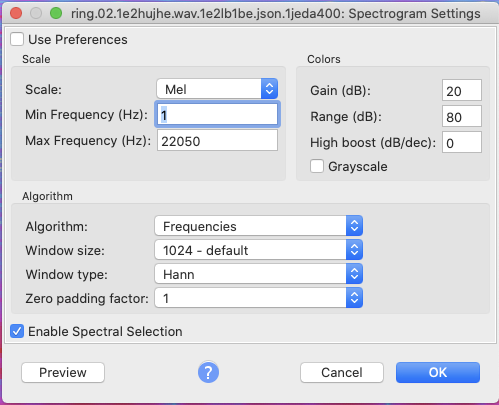
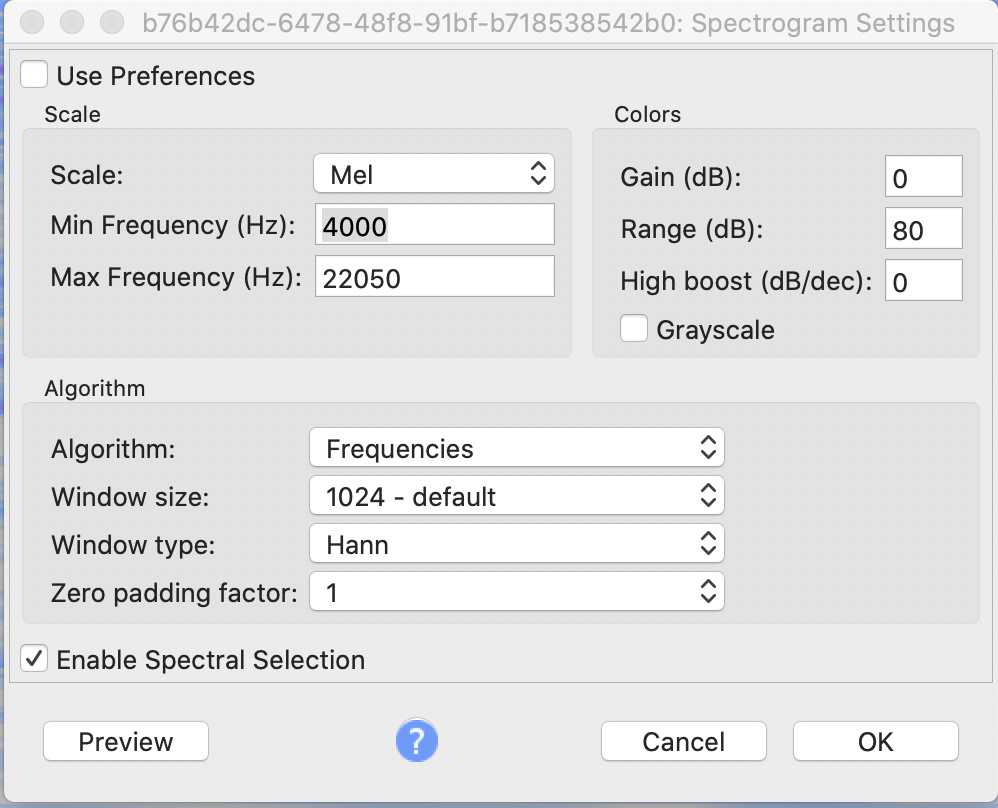
I have also shared a screenshot of the MEL settings (Algorithm / Window size / Window type / …) that I have used in audacity. I don’t know which settings are exactly used for the MEL spectogram in edge impulse studio. It would be good to share this so I can use same settings in audacity.
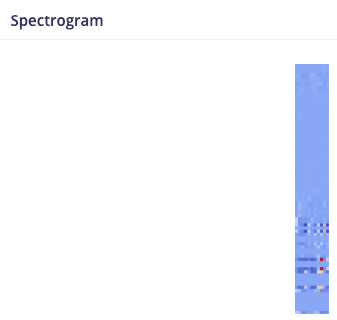
The edge impulse studio spectogram for same audio fragment:
Note that this audio fragment doesn’t contain a “ring” sound.
So in the audacity spectogram you no longer see the clear bands between 3500 Hz and 9000 Hz ( in other words the bands at 6800 Hz, 7800 Hz and 8300 Hz are no longer there).
I would expect that I can also indicate on the MEL spectogram in edge impulse studio that those bands are no longer there.
Good to see you’re working on your ring detection model
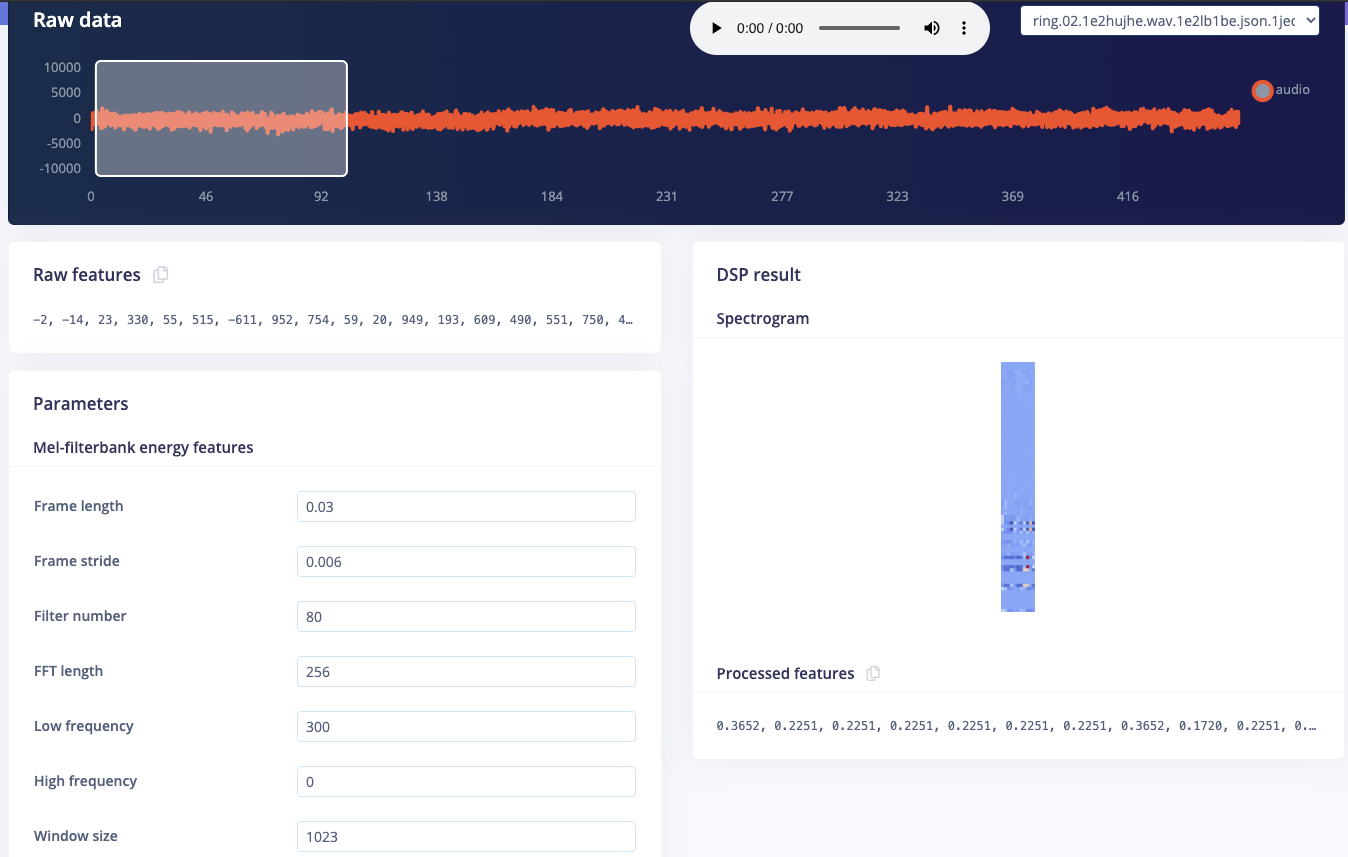
There are some differences between the Audacity mel-spectrogram and our MFE block:
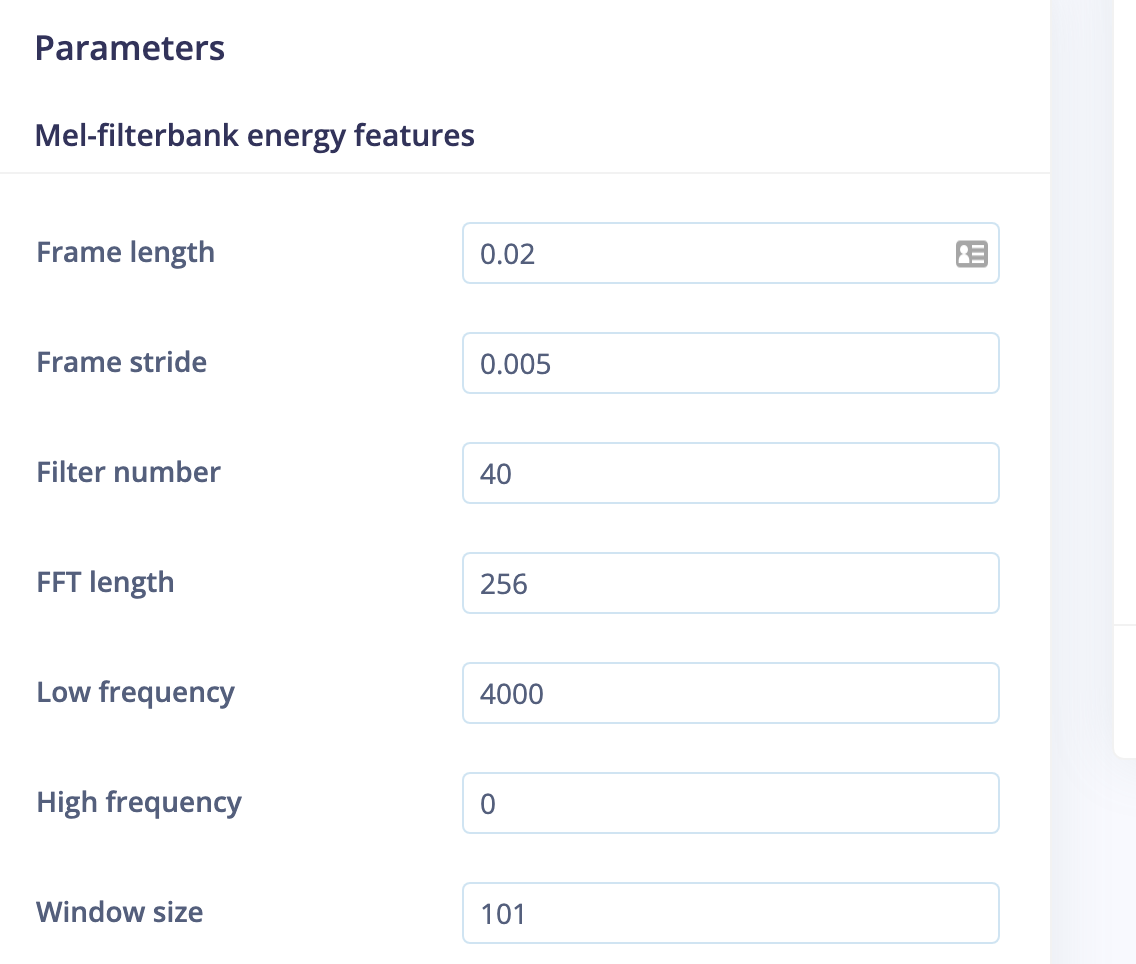
The MFE block does an additional transformation which is extracting features from filterbanks (applying triangular filters). Default value is 40 filterbanks and they are transposed on the y-axis of the spectrogram. That’s roughly what you have in audacity but with a lower resolution (40 lines). Scale is similar as by default high-frequency value is your sampling rate / 2.
Audacity applies some signal gain which can explain the visual differences on the high frequency.
Regarding your settings, I would suggest using default values and setting a low pass frequency around 3kHz. You could also decrease the frame stride as you did but a better alternative might be to increase your window size to 150-200ms.
I can also have a look at your project if you wish, just share your project ID.
I still admit that I don’t see the mapping with audacity
What is actually the meaning of the colors ?
I would expect from low to high energy is
dark blue
light blue
yellow
red
but in that case the bands you see in the diagram are not high energy bands but bands fluctuating in low and high energy !
I can set “gain” to 0 in audacity but that makes the bands even more clear. It doesn’t seem to explain the visual differences.
How can I set a low pass frequency to 3kHZ ?
My project ID = 8755, feel free to have a look at it.
Why do you think that increasing the window size to 150-200ms would help ?
Problem with that is that I am currently using test audio fragments of 100 ms and recordings are set to 100 ms. So it means some rework for me. Moreover the higher the window size the more likely it is I will not cover a complete ring sound.
You’re right about the colors interpretation, blue being low energy and red high energy. The low freq signals are stronger than the high frequency ones so they are more visible (doesn’t mean they don’t exist, it’s just visualization). If you filter out < 3-4kHz, this will make the high freq bands more visible.
I understand your point on the window size. With a larger window size you can keep the MFE frame stride to a reasonnable value (10ms) to extract more features. But I think with filtering out the low freq you should get some decent results already.
I indeed see bands in edge impulse spectogram for high frequency but those bands only show short periods of high energy (yellow/orange/red color). The bands also show periods where the energy is lower than usual (dark blue). This doesn’t match with audacity spectogram where the corresponding bands have high energy for the complete period.
I also would like to see the bands at 6700Hz, 7800Hz, 8400Hz and 9300Hz as they seem to be very typical for the ring sound.
Moreover MFE spectogram in the edge impulse studio shows only the energy for frequencies from 0 up to 8000. The frequencies 8000 - 22050 are not visible. See also: