Strange MFE spectogram for 1000 Hz sine wave

@janjongboom, @aurel,

I have created a sine wave of 1000 Hz using sox command:

sox -n -r 44100 other_1000Hz.wav synth 1 sine 7000

When I show this spectogram for the MFE buillding block it looks as follows:

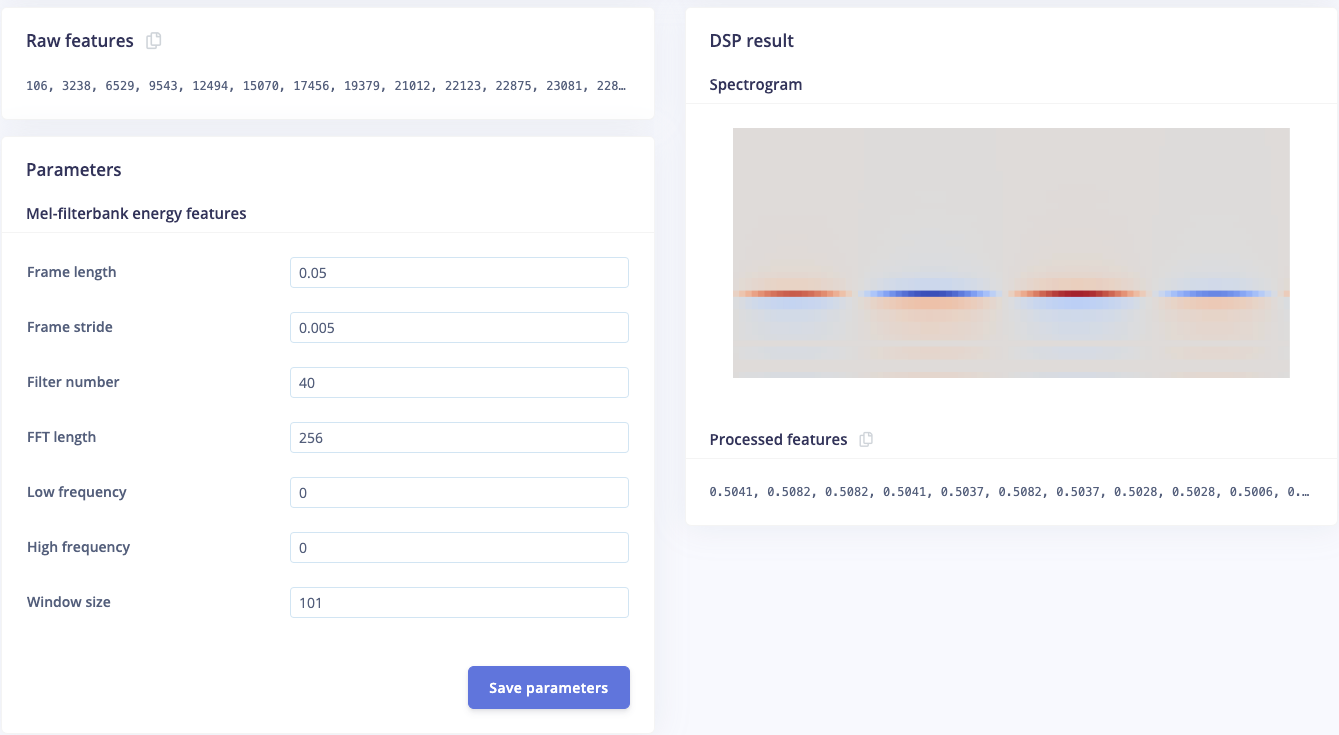
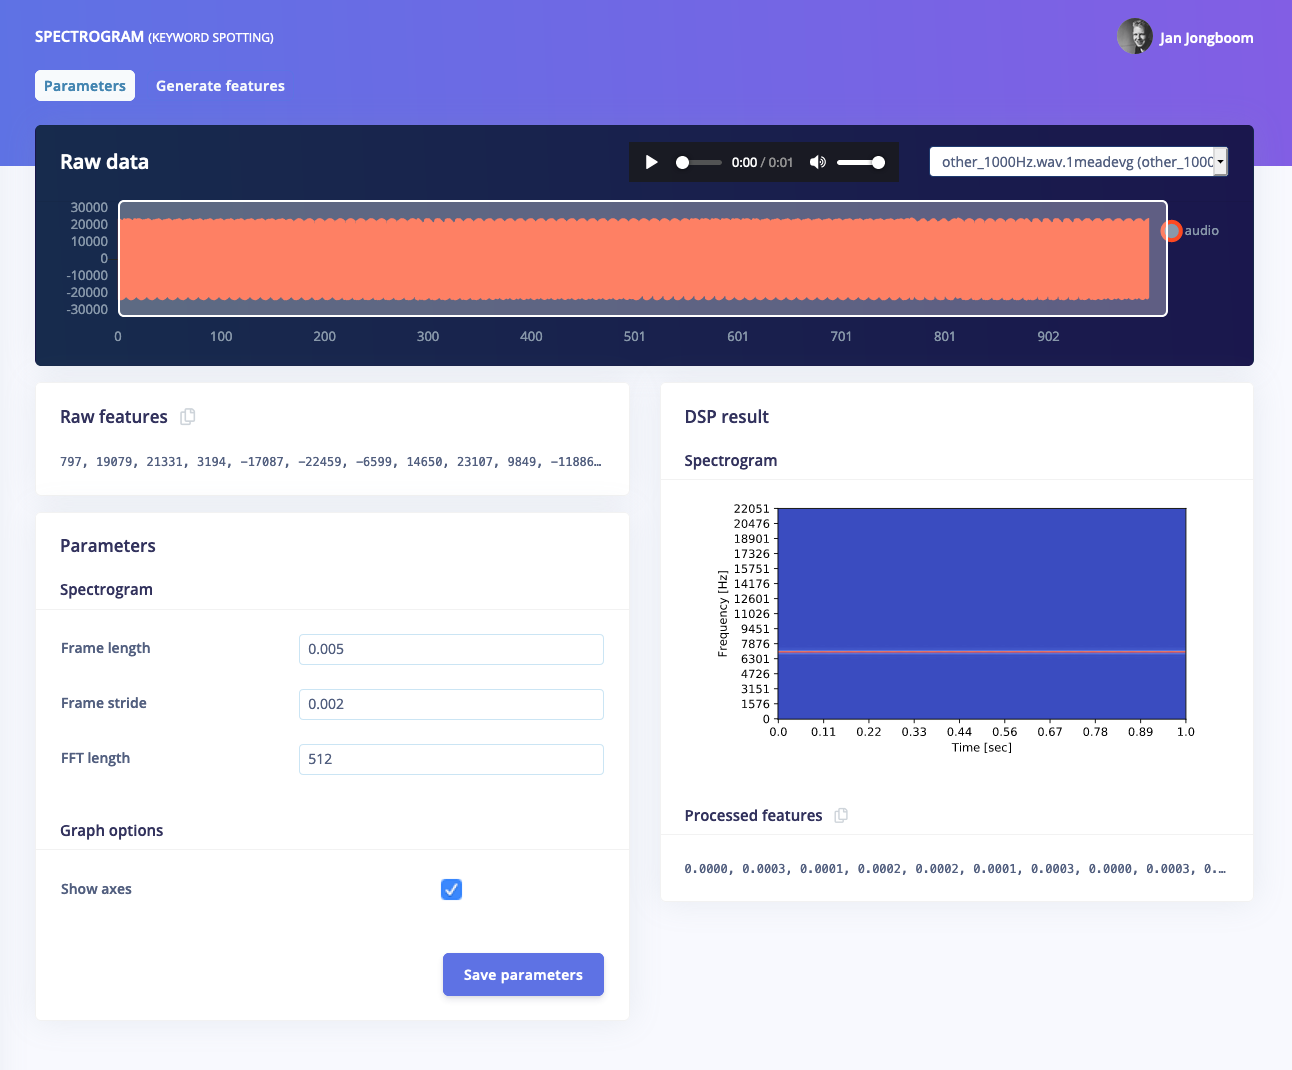
So it shows very high energy and also very low energy values around 1000Hz band.
I would not expect these “very low energy values”.
I would expect a single band around 1000Hz with constant high energy value.

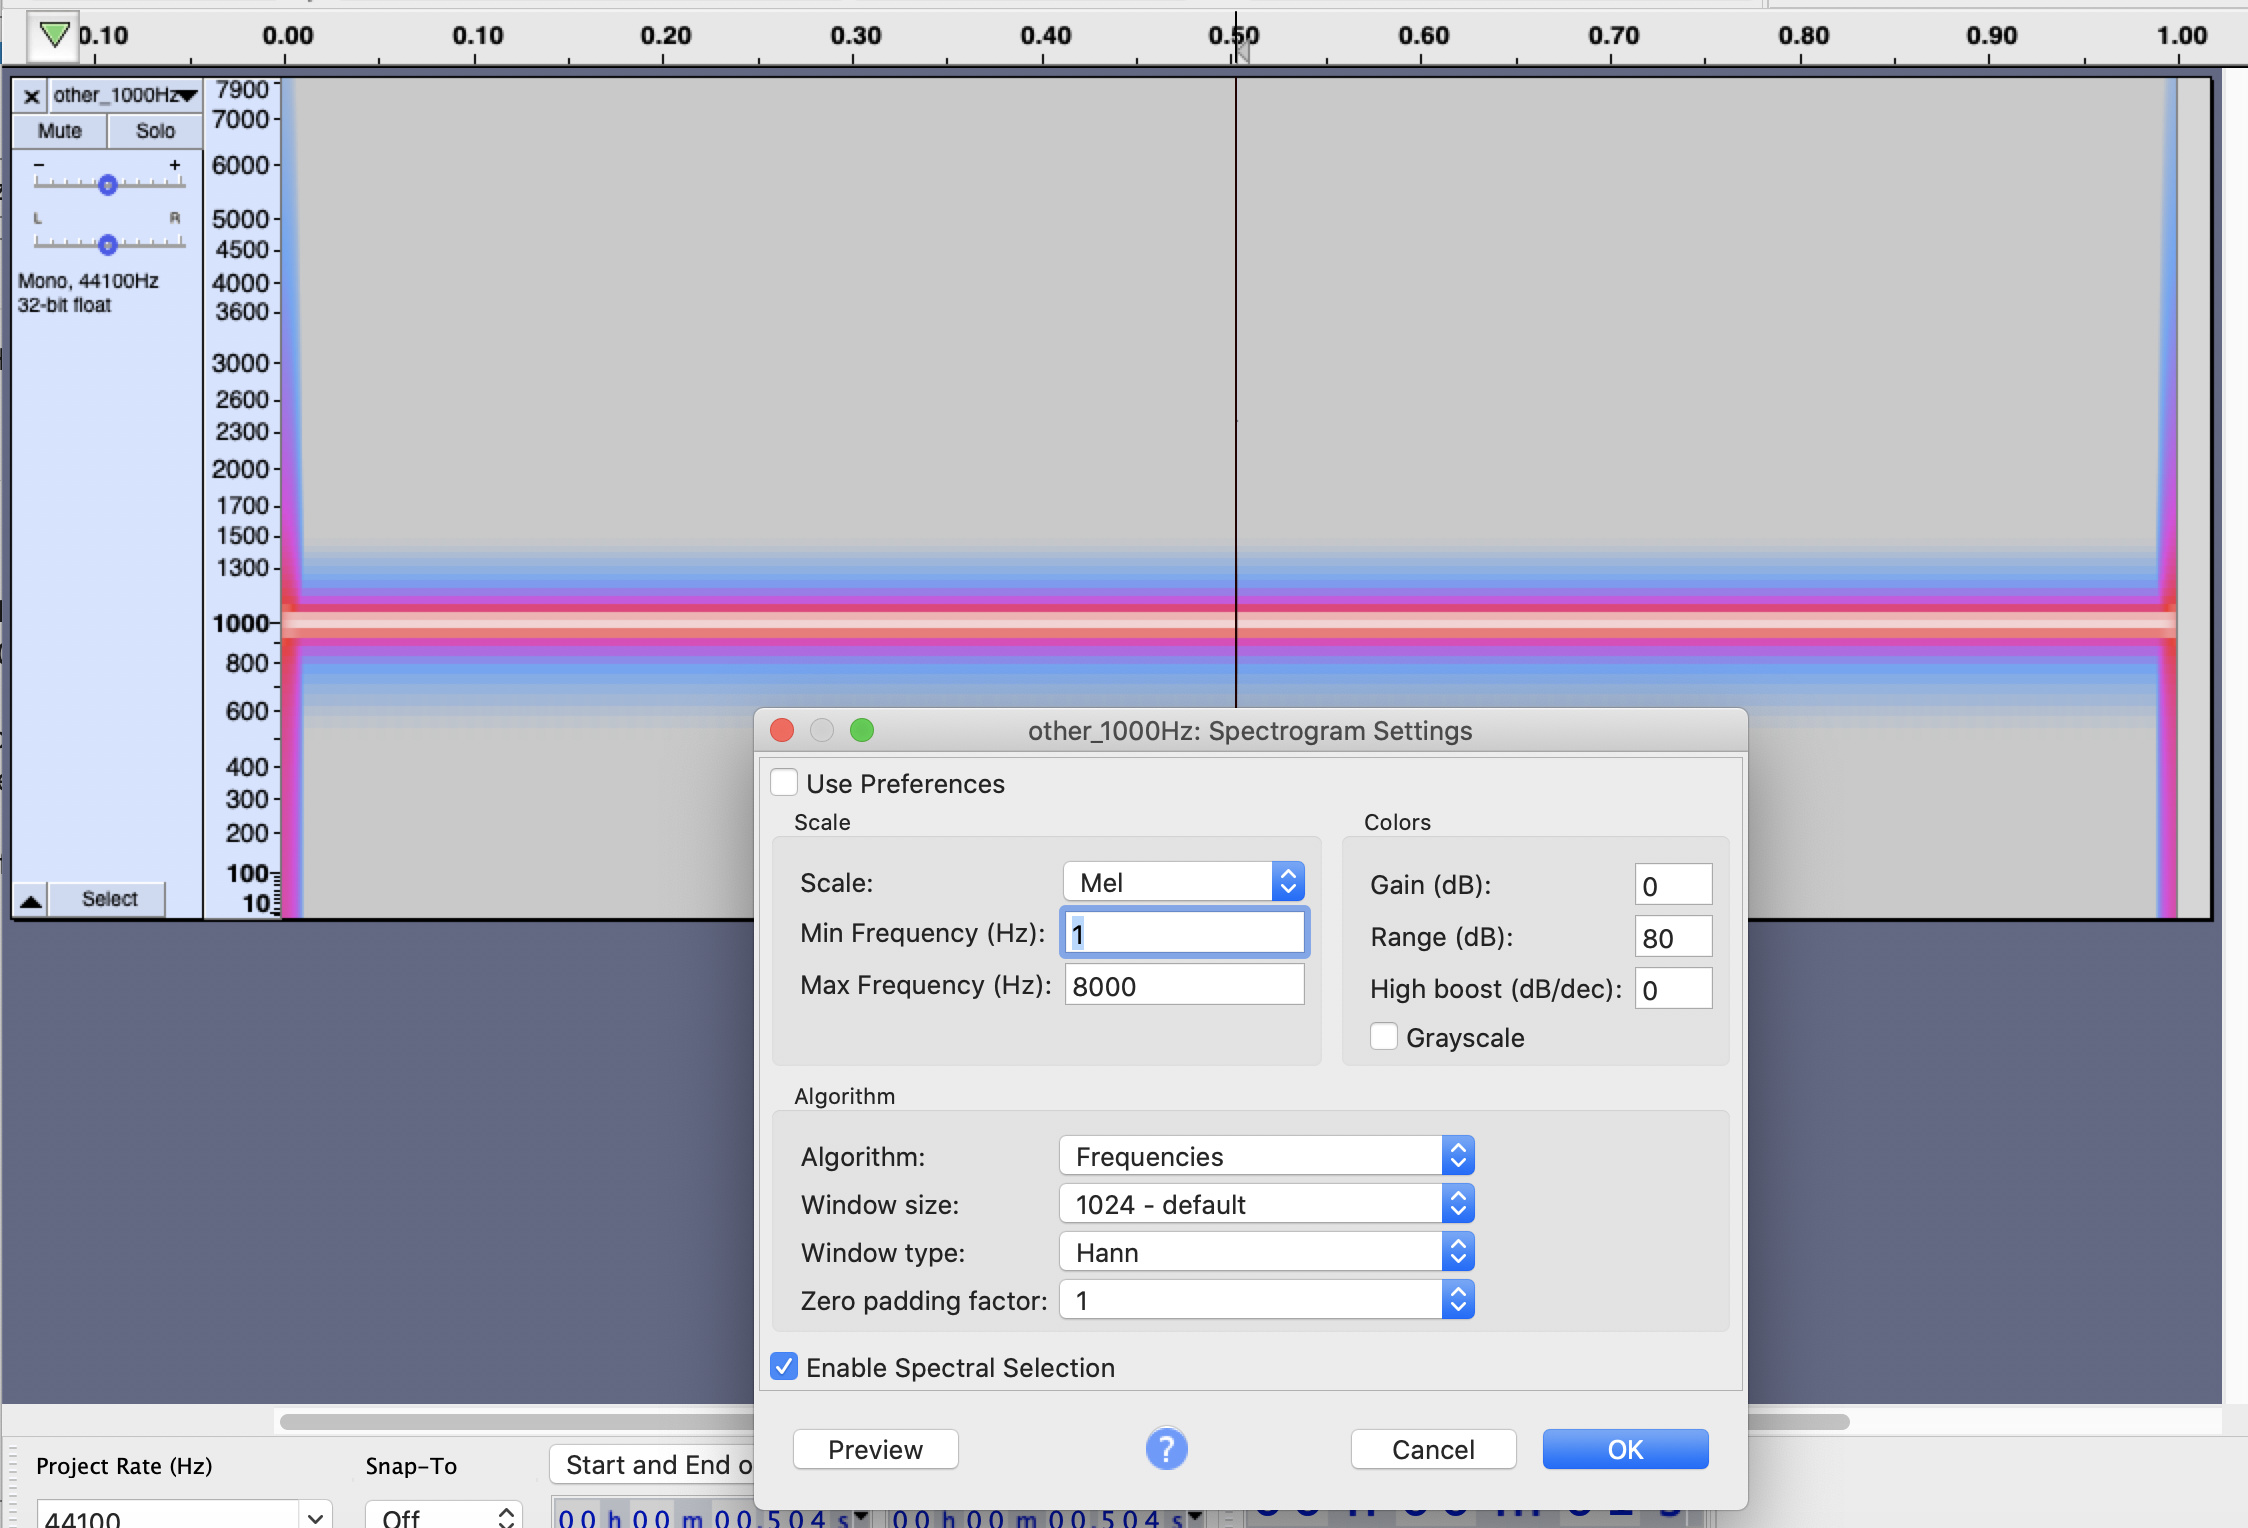
FYI: MEL spectogram for same audio fragment in audacity:

@janvda, I’m going to replace the MFE spectrogram by a normal one. That should fix all of this.

2 Likes

The command you gave me generates a 7000Hz wave right? Otherwise I don’t know what I’m looking at :wink:

But here’s the new spectrogram block which will replace the MFE one. The latter is too confusing (also for me).

2 Likes

Indeed the command above generates a 7000Hz wave.

It looks very good ! :+1: :+1:

Also very good that the frequencies are mentioned in the y-axis.