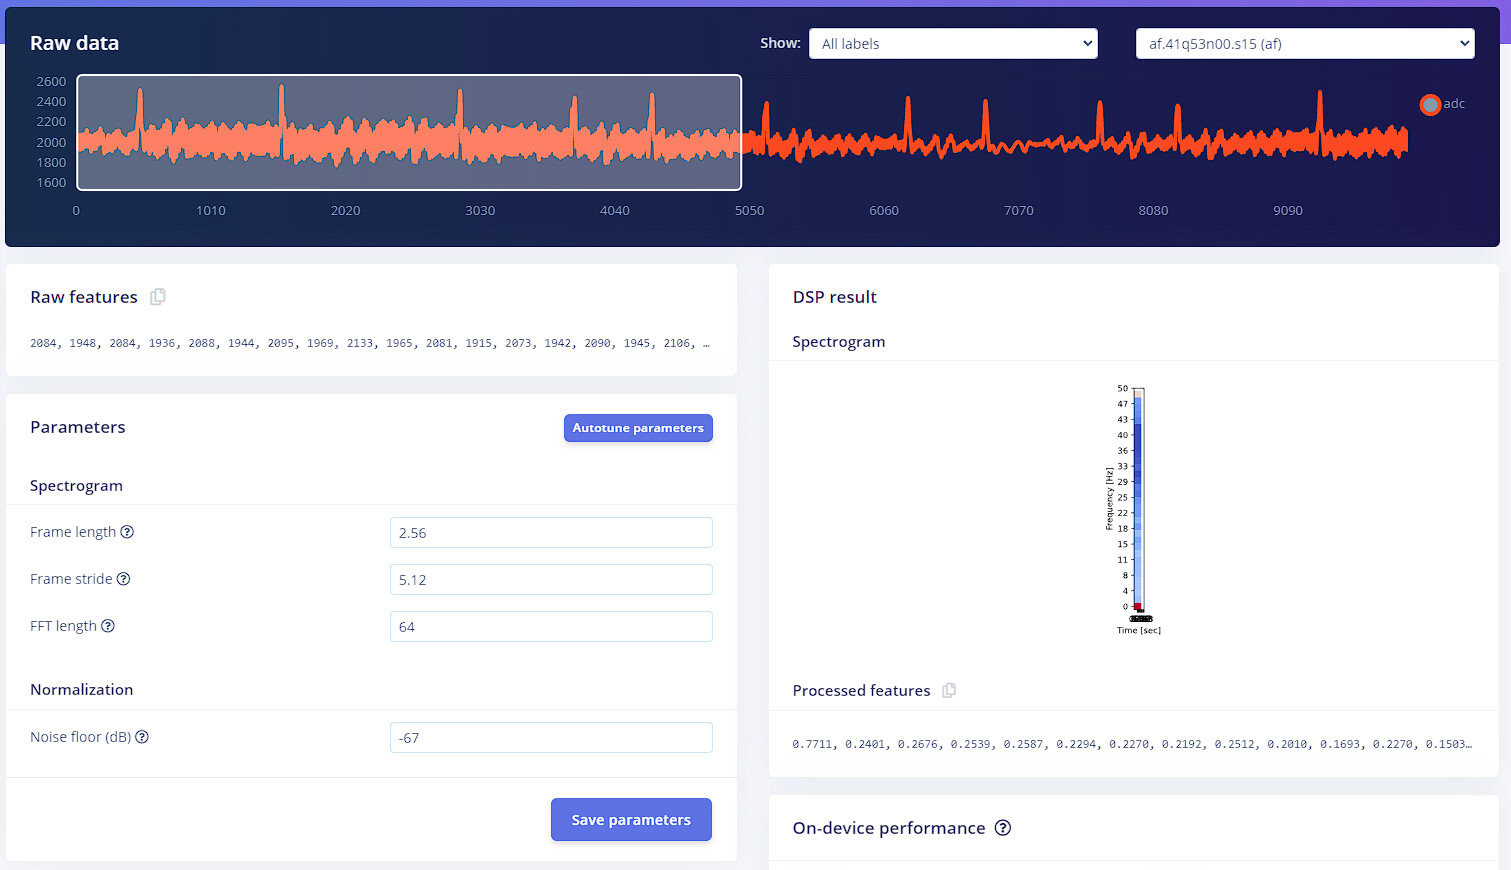
Is there a way that I can see the full length of the spectrogram?
Thank you
Project ID: 233372
Context/Use case: It’s my first time on edge impulse and I’m just trying to build a 1 lead ECG classification model with ad8232 with 10s length data and 100Hz of data frequency
If you need a 10sec-window size, you can change this parameter in the create impulse tab.
If you want to see a larger spectrum, you can change the parameters.
Hi, thanks for replying, yep the moment I made this post, I was just using the autotune feature and I think the system falsely interpreted my signal data so it gave that spectrogram result. But after several trials and calculations, I finally get the spectrogram that I expected from my signal data.