I’m trying to aquire data from accumulator drill with arduino nano bel sense.
Sampling rate is 100k
Drill has two speeds over approximately 10 Hz
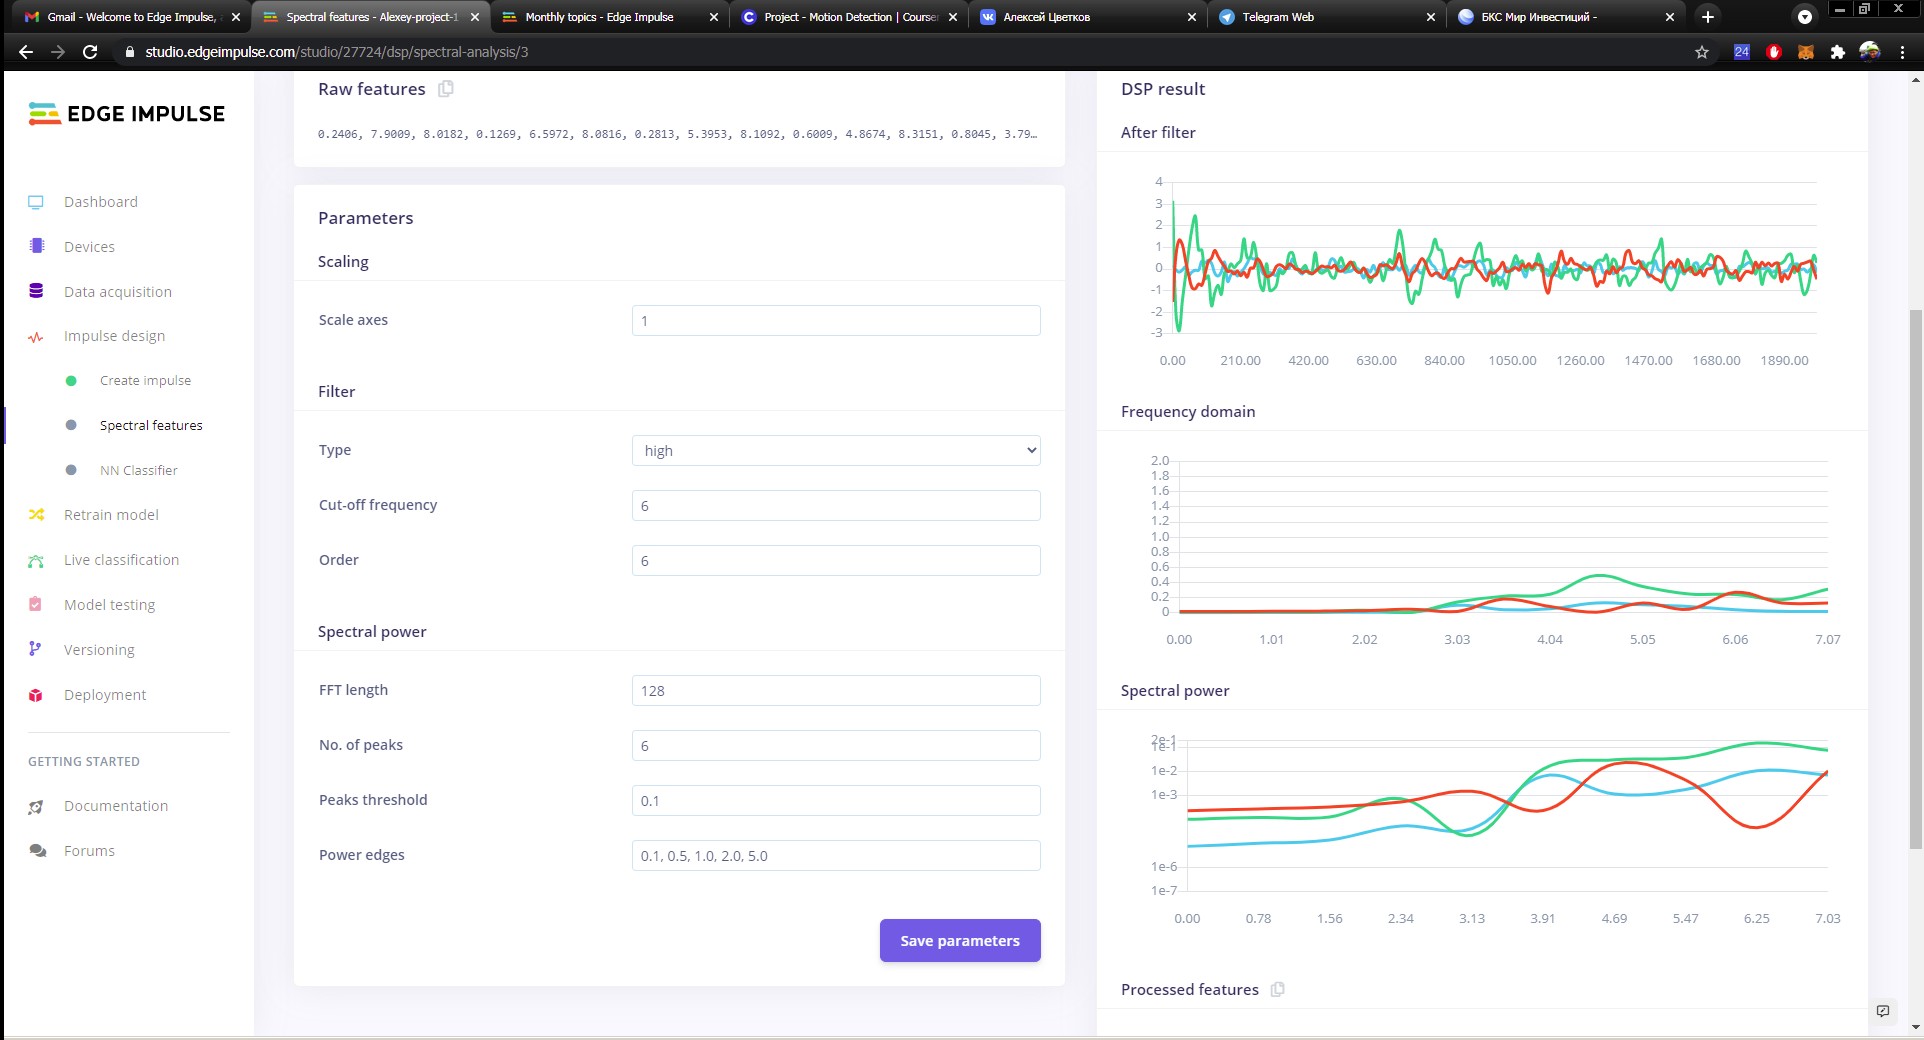
I’ve added spectral features analysis to impulse.
I’m expecting power density peaks near 10 Hz or above.
So I’ve added hi-pass filter with cut-off freq at 6 Hz.
But the graphics on the “spectral features” page have frequency axis only to 7 Hz and it can’t be extended to 10-20 Hz. So, I can’t evaluate the output of hi-pass filter.