Hello everyone, when I go to the “spectral resource” tab, the dominant frequency graph doesn’t show up for me, it shows Spectral power (linear). Are these graphics the same?
Project ID 147050
Hello everyone, when I go to the “spectral resource” tab, the dominant frequency graph doesn’t show up for me, it shows Spectral power (linear). Are these graphics the same?
Project ID 147050
Hello @marco_sousa,
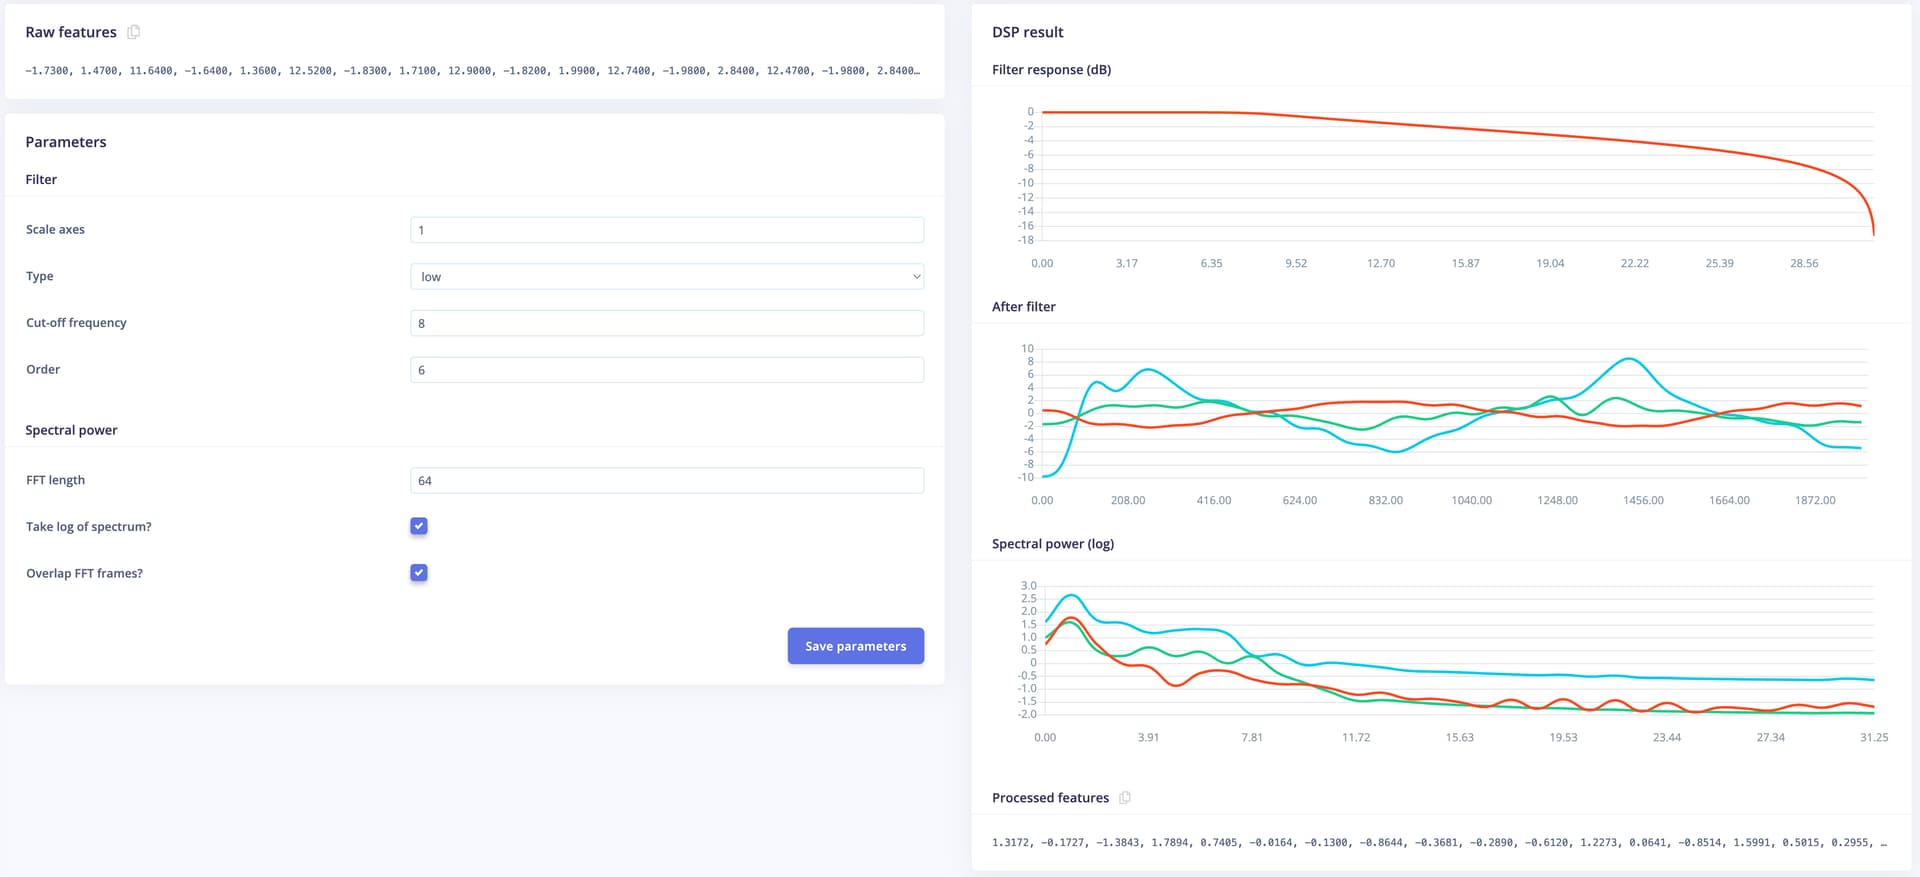
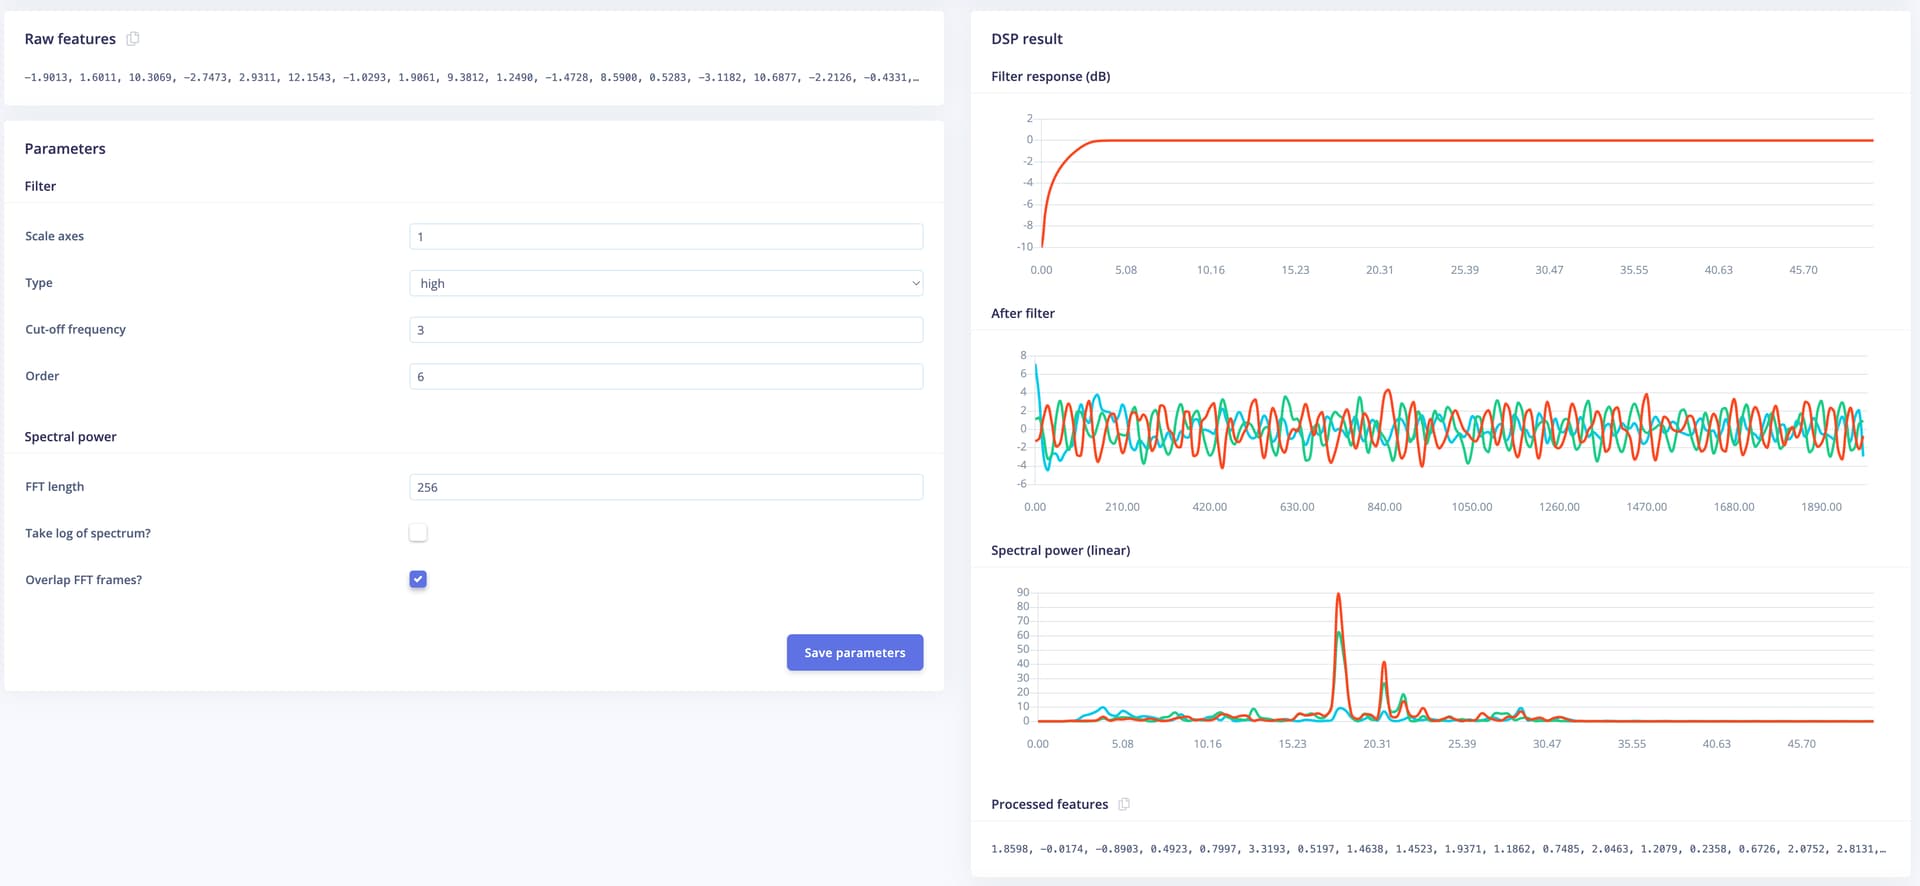
Not sure about your question but for the spectral features DSP block, you have two options to display (and calculate) the Spectral Power, either linear (as in your project) or using a log of it (the other screenshot):
Please, let me know if that helps.
Best,
Louis
hello, thanks for the answer!
Maybe I expressed myself badly, let me try to rephrase the question.
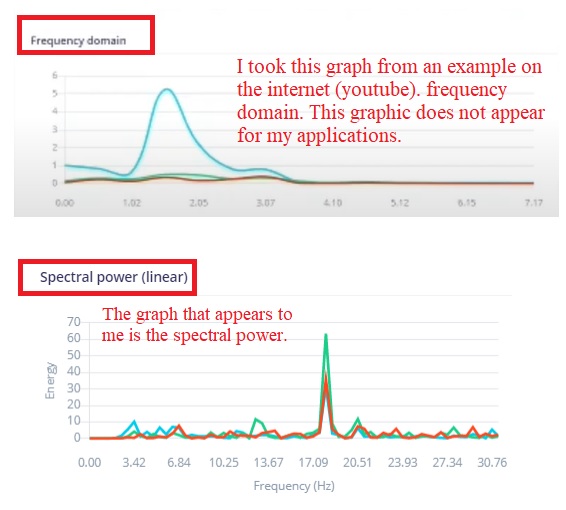
The FFT graph does not appear for me, in the frequency domain (Fourier). I watched some edge impulse videos all showed this graph.
The graph that appears to me is the Spectral power (linear), which is different from the frequency domain graph.
I don’t know if it’s the Edge impulse that limited this feature or if it’s some setting.
Hello @marco_sousa,
You mean that kind of graph?
If so, you can choose a different DSP block (MFCC, MFE or Spectrogram).
Best,
Louis
I’m working with data from an accelerometer, so I’d like to see the predominant frequencies in the signal.
Hello @marco_sousa,
OK I got it, we changed the spectral analysis DSP block a couple of month ago.
The code is still available but you’ll need to define the implementation_version = 1 in a custom DSP block: processing-blocks/dsp.py at master · edgeimpulse/processing-blocks · GitHub
Best,
Louis