Question/Issue:
I have build a model for regression analysis. So the data is uploaded and the labels are provided through csv wizard.
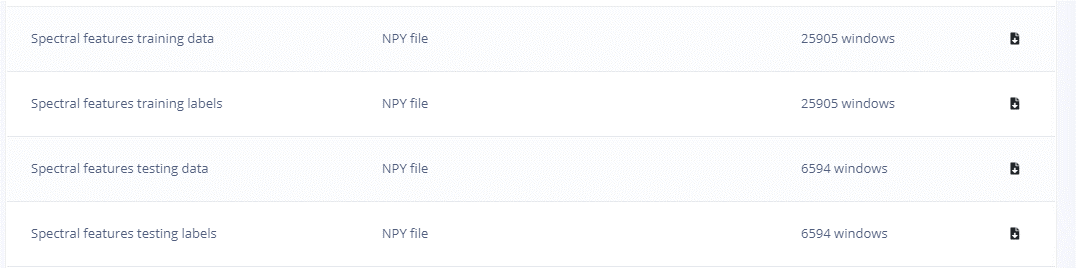
But after downloading the training label data it is showing different dimension from the uploaded data and the title is ‘Spectral Analysis of training labels’.
Why spectral analysis of training labels are done?
The input label is one dimensional while the spectral analysis of label is 4 dimensional. Same issue with the testing label. This is creating problem to download and check the model separately.
Is there a way to download the training label and testing label after the split?
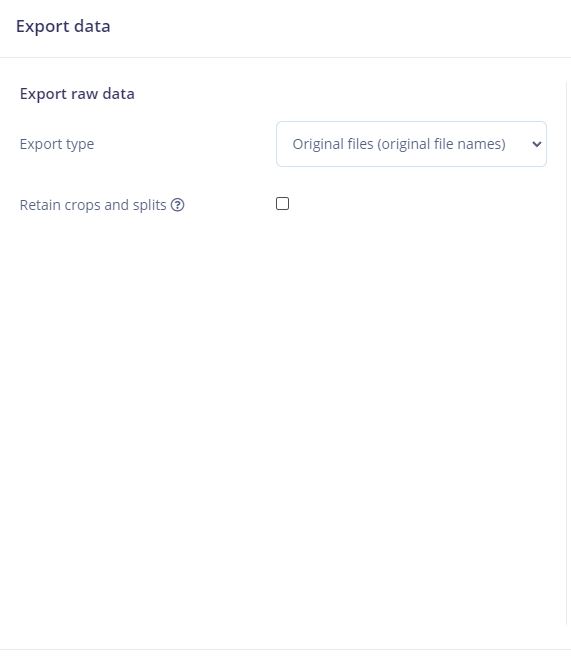
The data we are downloading does not contain the label.
Thanks in Advance
What was the problem you encountered while using this block, the post processing changed the order of rows?? Not quite sure I understand the problem.
After setting up the CSV Wizard, you can proceed to use the Spectral Analysis block by configuring its parameters such as the type of filter to apply, the cut-off frequency, and the FFT length. This block is designed for analyzing repetitive patterns in signals and can be fine-tuned using the DSP Autotuner for optimal parameter selection.
Lets review what happens on the CSV Wizard:
First you a model that was uploaded via BYOM? Then you tried to upload more data to the model?
Upload a file: Choose a CSV file to upload and select “Upload File”. The file will be automatically analyzed.
Analyze your data: The CSV Wizard will check if the data contains labels, if it’s time series data, raw sensor data or processed features, and if it’s separated by a standard or non-standard delimiter. Adjust settings as needed.
About your data: Select the timestamp column or row and the frequency of the timestamps. If you don’t have a timestamp column, you can add a timestamp later.
CSV Wizard: About your values: Select the label column, or if you don’t have one, you can add a label later. Also, select the columns that contain your values.
Split up your samples: Set a length limit for your sample size and decide how to deal with multiple labels in a sample.
Please help in clarifying the issue and I will forward to the tech team
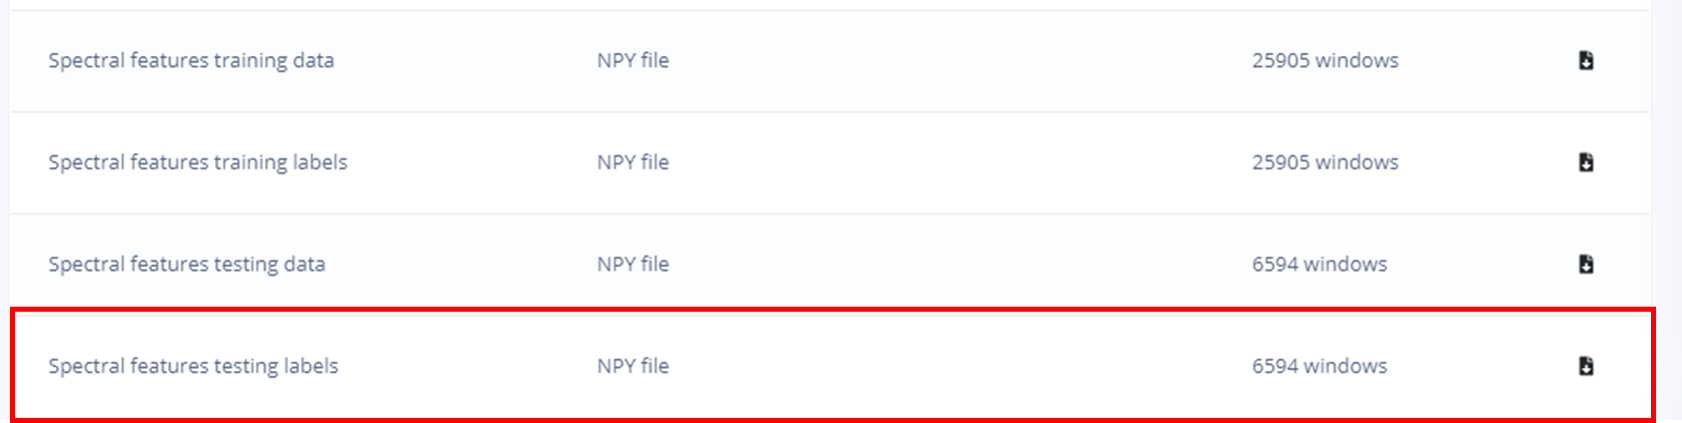
As marked in the image, the spectral feature of the testing label are being done. In case we want to test the model separately, the label for the test data along with the test data are being downloaded in a different format where it is getting difficult to separate out the label and the test data.
In the above procedure the values, id are available in the file but the label are not present. It can be found in the file name. Is it possible to get the label in excel file ?