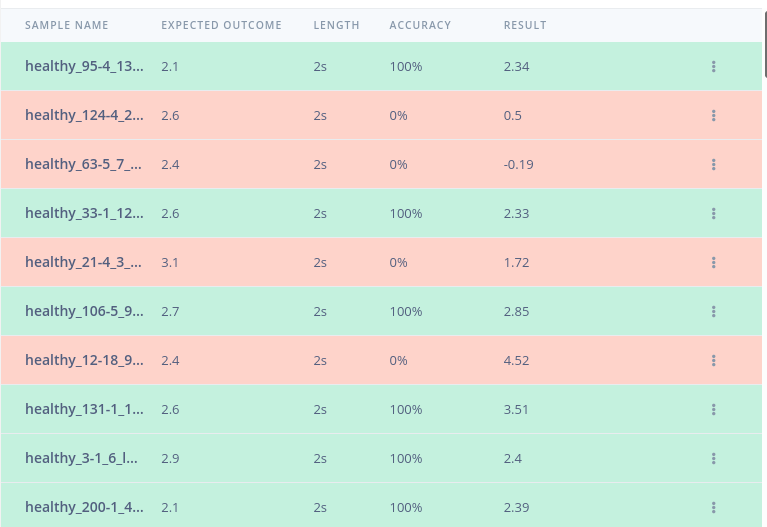
expected outcome = the truth
result = the model output or estimated value
I my case I have a model testing results accuracy of 86%. I am a little confused about the meaning of accuracy. Is it possible:
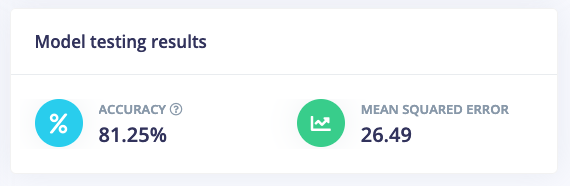
depending on the used loss function, to obtain the Mean Squared Error (MSE) or Mean Absolute Error (MAE) for the model testing. In this way I get a better feeling about the performance of the different trained models.
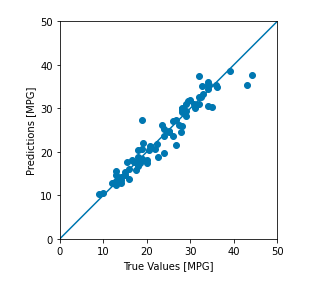
to obtain a plot estimated vs.truth value in the dashboard, see for example reference: [Basic regression: Predict fuel efficiency](https://www.tensorflow.org/tutorials/keras
/regression), plot shown below:
(In my case it would be walking speed.)
So far I see it is not possible to export the table from the model testing. This will give my the ability to make this plot and perform some extra analyse.
Hi @Joeri good suggestions, let me plan some work in to enable that. The accuracy currently reflects whether the predicted result is within the error margin set under ⋮ > Set confidence thresholds (10% default, determined by min/max in your training set). That’s about the best I could come up with to get some sort of accuracy from a regression model.
So far I see it is not possible to export the table from the model testing. This will give my the ability to make this plot and perform some extra analyse.
@janjongboom thanks for the feedback, this gives a better understanding of the meaning of accuracy.
The accuracy currently reflects… That’s about the best I could come up with to get some sort of accuracy from a regression model.
So far I understand this is EI own definition? Could be of interest to add this to the documentation (small note in the dashboard). But maybe this will be the case if it will be released (in see a ? in your image).
Give me a message if I can be of help, provide feedback, for example concerning the visualization.
@janjongboom thanks to add the MSE to the dashboard. This is helpful.
Currently, I use the API to extract the test results (predictions) in this way I can perform the extra analyse and visualisation.