Is it possible to import and analyze data like below?
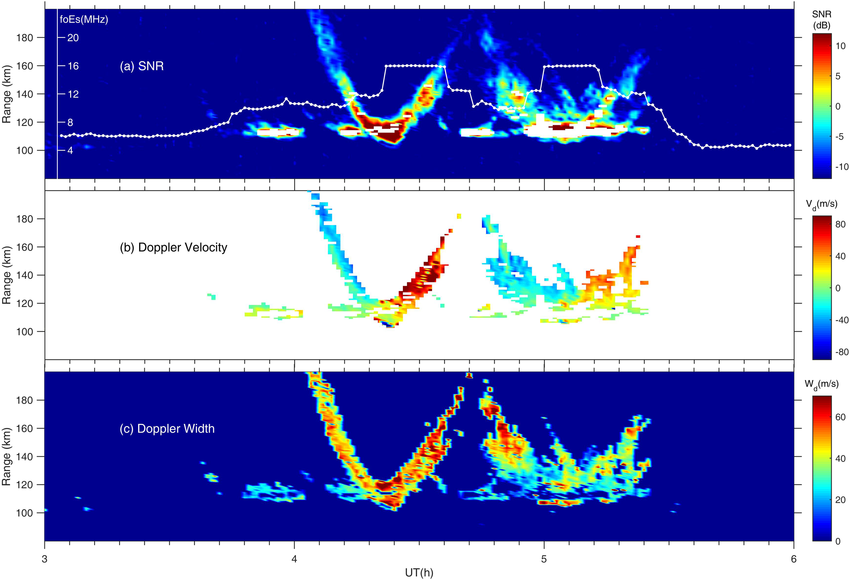
In practice the radar sensor sends data like below.
time, range, value
I want to do object detection and gesture recognition.
Is it possible to import and analyze data like below?
In practice the radar sensor sends data like below.
time, range, value
I want to do object detection and gesture recognition.
Oh interesting let me check with our DSP team, @AlexE @yanedge
Have you got any input here?
Best
Eoin
Hi @kumagai what I would do is convert your samples to an image (monochrome 8 bit) so you can keep the visualizations in studio. You may lose some dynamic range this way, but taking log of your values is probably going to be helpful anyway, and this can fit you into 8 bits
Also, I see you have 3 plots, you could encode each of those into different color channels (ex, snr becomes R, doppler velocity becomes green, etc)
The ML will work the same way regardless…you’ll want 2D conv layers. Encoding as image will just make it easier to navigate the data in Studio
Alternatively, just upload the data as time series (ie, a flat array) and use a reshape layer to get the correct channels and dimensions prior to the 2D conv layers. (you would do this in expert mode) Advantage here is that you can use full dynamic range (not limited to 8 bit input)
I’ve also captured this data type as a feature enhancement…let us know what you end up deciding and how it all works out!