Object Detection using FOMO returns?

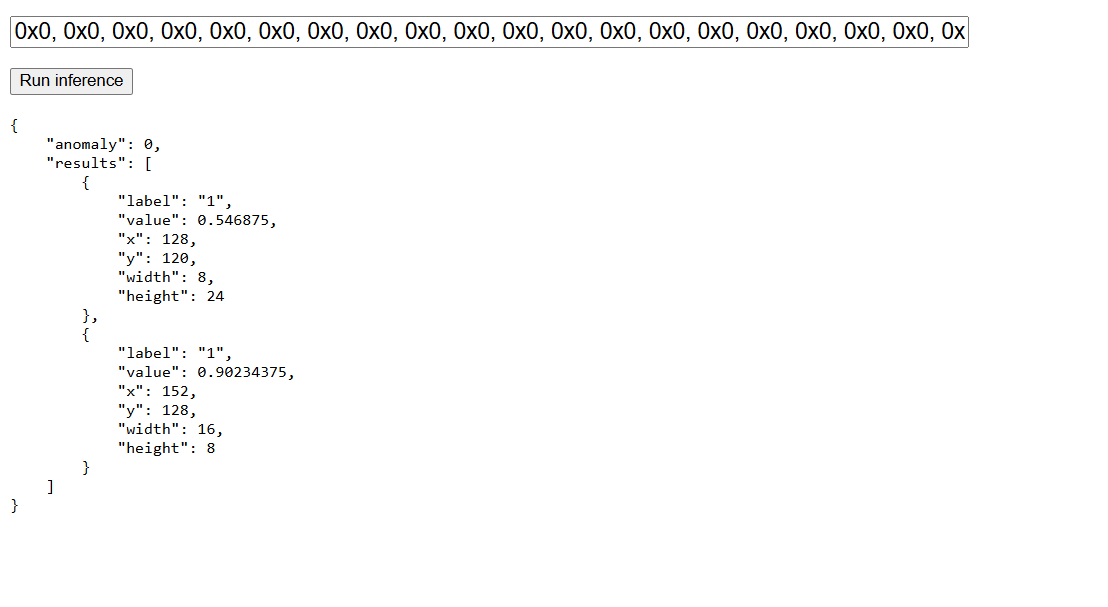
I am using the FOMO 0.35 to detect human presence, I don’t really need the bounding box exactly, I am happy to get the centroid as mentioned the the docs. But when I use tflite Interpreter() to load and run to invoke() inference result[0][0][0] is a list of size 6

It says they are x, y, w, h, label, conf but I couldn’t identify the position of these values in the list

I would love to know the index position of these fields in the record list returned

like I wanna find if the conf is in list[0] or list[5]

I have logic to implement with the detection result

Hopefully waiting for reply

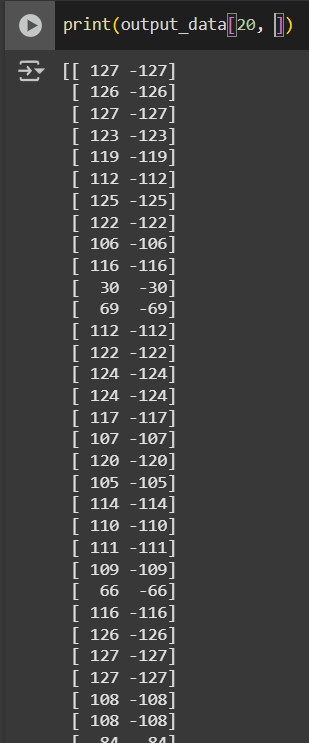
interpreter.invoke()
output_data = interpreter.get_tensor(output_details[0]['index'])
print("Output:", output_data)

Input shape: [ 1 480 320 3]
Output: [[[[[154 145 147 158 28 232]
[149 150 150 157 37 230]
[148 154 151 158 19 229]

[149 151 147 147 35 220]
[148 148 145 146 41 221]
[150 146 143 149 46 228]]

[[159 136 146 163 27 233]
[151 137 151 161 39 230]
[149 146 155 164 18 230]

[147 152 148 155 38 220]
[146 149 145 154 37 220]
[149 146 141 157 51 230]]

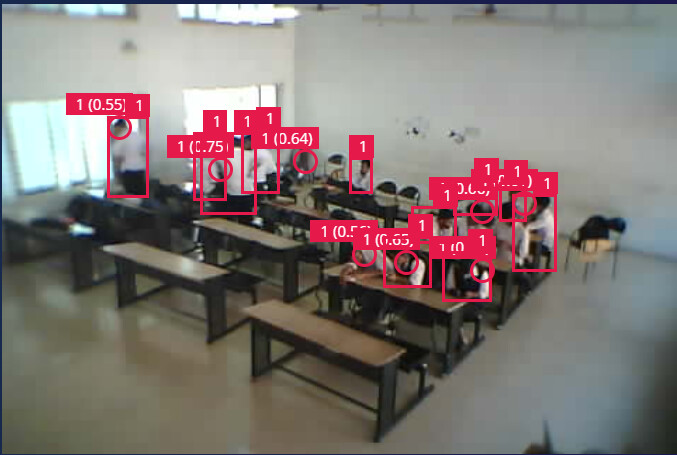
These are the list returned by the model

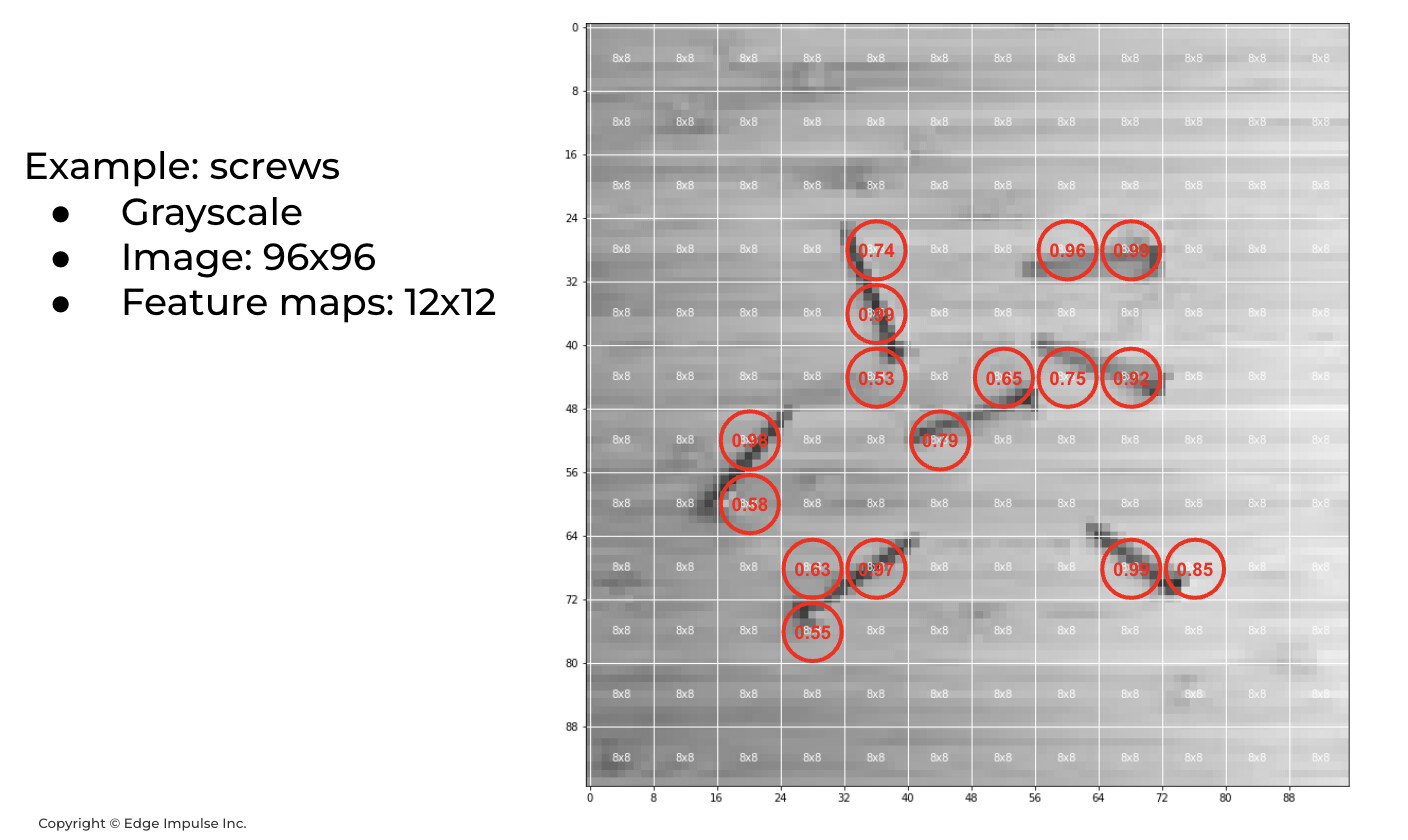
my model takes 320x320x1 images to return a 40x40 grid with the confidence of object

I found that label is an element of this list, but I have only 1 label for human class which is “1”

I didn’t see any “1” here but saw many other values which makes no sense to me

Please provide the signature of the data structure returned such as index representation

Hi @mathaianson

FOMO returns a grid-based classification rather than traditional bounding boxes. Each grid cell output contains class probabilities. If the output tensor is [1, grid_height, grid_width, num_classes], you interpret it by iterating through grid cells, and selecting the class with the highest probability if above a certain threshold.

Hope this helps,

Best

Eoin

I’m sorry I found that I was loading a yolov5s.tflite model to my interpreter

Now when I inference an image using project deployed to run in browser using js wasm, I get this result with bboxes

But when I inference the same image using tflite.inference() in google colab, It returns a result[1, 40, 40, 2]

My model is FOMO 0.35 with input of 480x320x3 images fit to longest into 320x320x1 (greyscale) ### The docs says FOMO returns centroid but the below output doesn’t feel like a x, y coordinate . It looks like [a -a]

inner grids returns [64 -64] , [45 -45] , …

[{‘name’: ‘serving_default_x:0’, ‘index’: 0, ‘shape’: array([ 1, 320, 320, 1], dtype=int32), ‘shape_signature’: array([ 1, 320, 320, 1], dtype=int32), ‘dtype’: <class ‘numpy.int8’>, ‘quantization’: (0.003921568859368563, -128), ‘quantization_parameters’: {‘scales’: array([0.00392157], dtype=float32), ‘zero_points’: array([-128], dtype=int32), ‘quantized_dimension’: 0}, ‘sparsity_parameters’: {}}] /n [{‘name’: ‘StatefulPartitionedCall:0’, ‘index’: 70, ‘shape’: array([ 1, 40, 40, 2], dtype=int32), ‘shape_signature’: array([ 1, 40, 40, 2], dtype=int32), ‘dtype’: <class ‘numpy.int8’>, ‘quantization’: (0.00390625, -128), ‘quantization_parameters’: {‘scales’: array([0.00390625], dtype=float32), ‘zero_points’: array([-128], dtype=int32), ‘quantized_dimension’: 0}, ‘sparsity_parameters’: {}}] /n

[[[ 127 -128]
[ 127 -128]
[ 127 -128]

[ 127 -128]
[ 127 -128]
[ 127 -127]]

[[ 127 -128]
[ 127 -128]
[ 127 -128]

[ 127 -128]
[ 127 -128]
[ 127 -128]]

[[ 127 -128]
[ 127 -128]
[ 127 -128]

[ 127 -128]
[ 127 -128]
[ 127 -128]]

[[ 127 -128]
[ 127 -128]
[ 127 -128]

[ 127 -128]
[ 127 -128]
[ 127 -128]]

[[ 127 -128]
[ 127 -128]
[ 127 -128]

[ 127 -128]
[ 127 -128]
[ 127 -128]]

[[ 127 -127]
[ 127 -128]
[ 127 -128]

[ 127 -128]
[ 127 -127]
[ 126 -126]]]

Also when I use model testing and live classification in edge impulse my model is perfect

but I couldn’t understand how the results[1, 40, 40, 2] is plotted as a centroid in the image with a confidence score

image

I have a logic to perform in my project according to the position of the true positives detected. If you help me the way the result returned from FOMO int8 tflite model which is a list of 2 values for each grid is converted to centroid and confidence value

@Eoin

Can you please look into it. Thanks

Hello @mathaianson,

The return you obtain with the tflite interpreter is the full feature maps (or grids).
FOMO uses MobileNetV2 as a base model for its trunk and by default does a spatial reduction of 1/8th from input to output (e.g. a 96x96 input results in a 12x12 output, or a 320x320 input results in a 40x40 )

On the FOMO architecture (and what you obtain with the export from the studio), we then apply a classifier logic to the end of the network to classify each “cell” independently + some post-processing to remove objects that are too close to each other.

Here are two slides that could explain the text above:


Let me know if that helps.

Best,

Louis