By using the EI API you get access to the raw data, extracted features, etc. This gives the user the possibility to perform for example plotting, derive some statistics… Of course, you can do much more using the EI API.
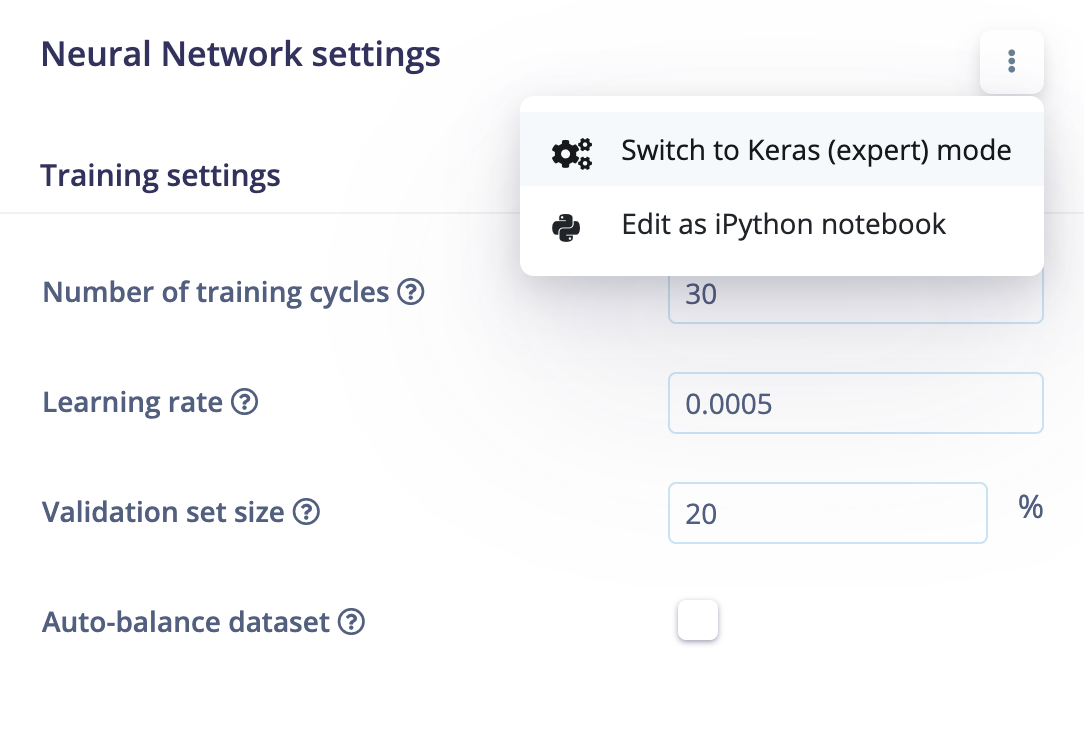
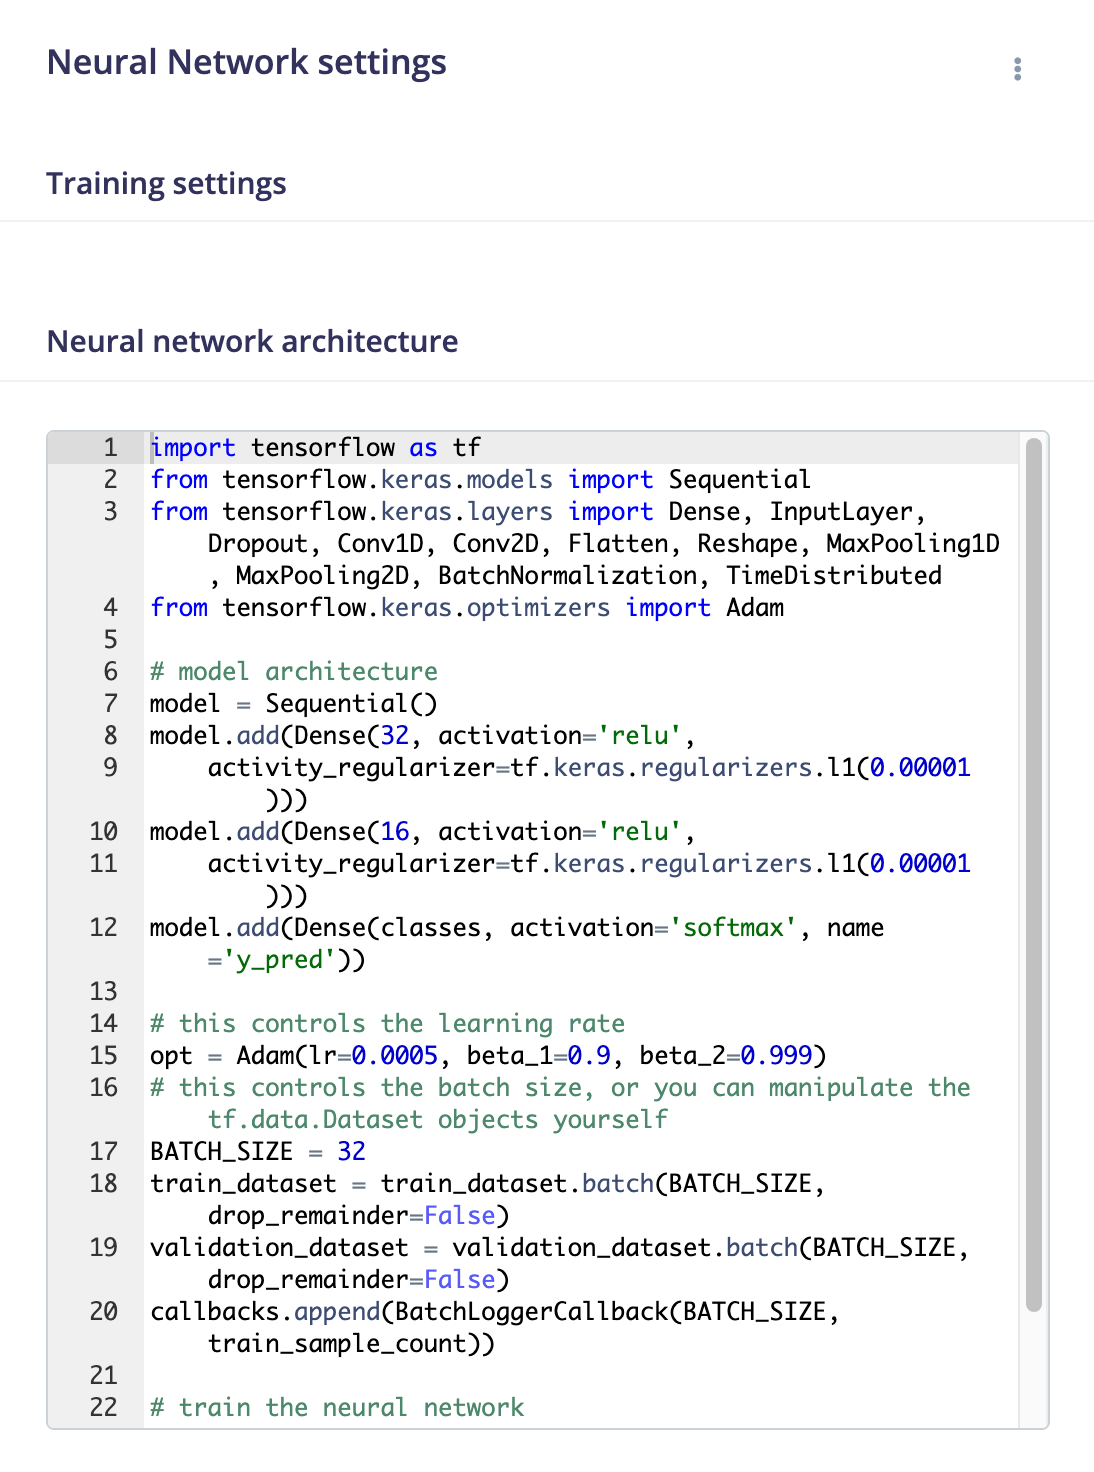
It could be of interest to have some (basic) scripting functionality inside the dashboard itself, for example for plotting (loss vs. epoch, statistics, …), a solution can be a Jupyter Notebook that is running inside the dashboard. (Something like Analyze and Visualize as in Amazon SageMaker Studio). In this way, users can build their own function and share this with the community.
You can actually already develop your own plots, graphs, and more stats by creating your own Python/Matlab custom DSP block deployed inside a docker container, check out our tutorial on this here: https://docs.edgeimpulse.com/docs/custom-blocks