Hello @davwang,
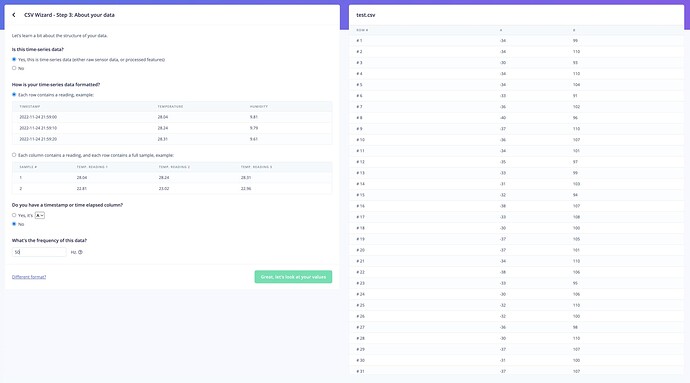
If you want to upload that as one sample, you would need to add a constant timestamp increase (understand a constant sampling frequency).
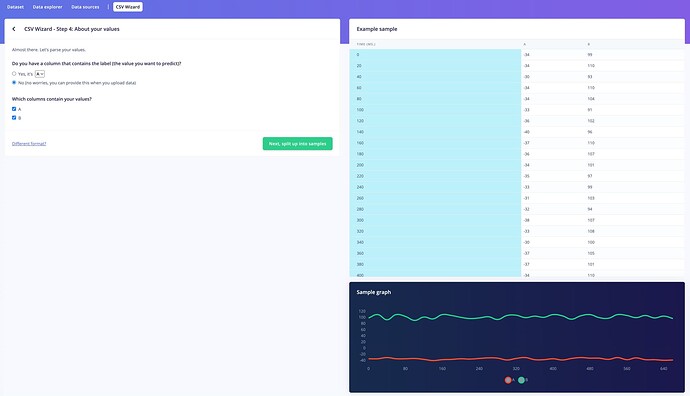
You might want to try the CSV Wizard: https://docs.edgeimpulse.com/docs/edge-impulse-studio/data-acquisition/csv-wizard where you can set the sampling frequency.
Best,
Louis
I want to upload the (x,y) coordinates array, I hope this screen can display the curve. not a constant sampling frequency curve.
Hello @davwang,
Unfortunately this is not supported at the moment, the x axis has to be a constant time series.
However, you can do something like that where you’d have your two columns as an Y axis:


