Hi everybody
I’m developing a project that involves using an accelerometer to collect vibrations from a component, in order to use it as a feature for my predictive calculations.
However, I wanted to understand how Edge Impulse transforms the raw accX, accY and accZ data into various features such as accX power spectrum, accY power spectrum and accZ power spectrum. Here is the attachment I want to get:
accX Spectral Power 21.36 - 21.61 Hz
accY Spectral Power 11.11 - 11.35 Hz
accZ Spectral Power 17.94 - 18.19 Hz
.........................................................
accZ Spectral Power 30.15 - 30.4 Hz
accX Spectral Power 19.17 - 19.41 Hz
accX Spectral Power 10.62 - 10.86 Hz
I’ve been reading the documentation GitHub - edgeimpulse/processing-blocks: Signal processing blocks but I haven’t been able to select the key part of what I want. So I looked for other sources like stackoverflow and scipy signal.
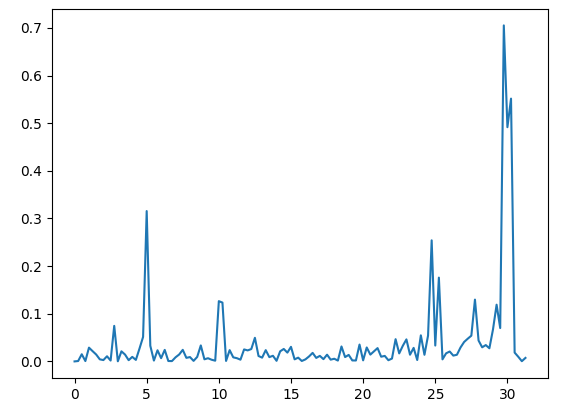
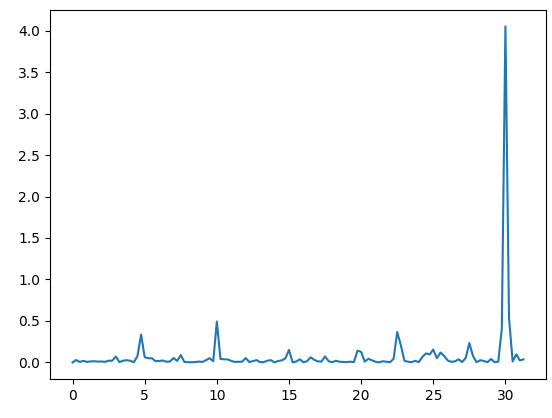
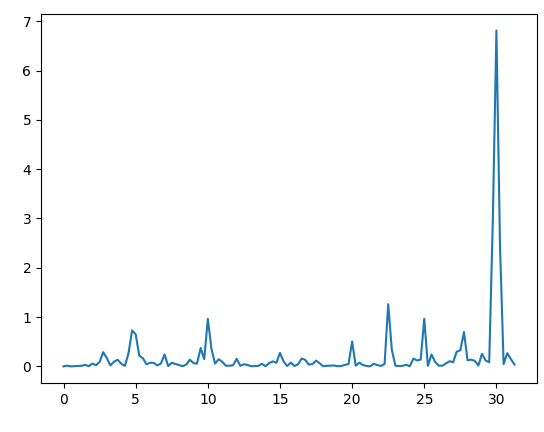
The results I got were these:
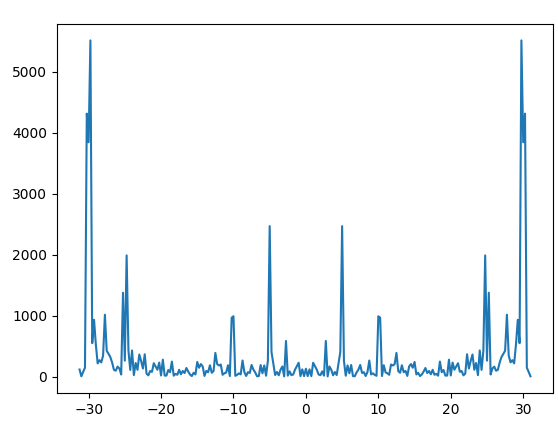
I don’t know if this graph makes sense for what I want to get, which would be the power spectrum
data = dado['accX'].values
ps = np.abs(np.fft.fft(data))**2

time_step = 1 / 62.5 # sampling frequency
freqs = np.fft.fftfreq(data.size, time_step)
idx = np.argsort(freqs)

plt.plot(freqs[idx], ps[idx])
plt.show()
Imagine that, given inputs with the following table:
accX accY accZ
0 … … …
1 … … …
2… … …
how do I calculate the power spectrum in order to add to this table so that it can be used in a support vector machine model
accX accY accZ accxPowerSpectrum accyPowerSpectrum ...
0 … … …
1 … … …
2 … … …