Question/Issue: Hello everyone,
Greetings of the day.
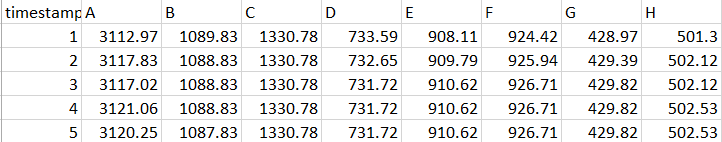
I currently have some data which is available in csv format. A sample of my data is given below. Could anyone tell me how to do machine learning on this data? Because all the models I build either have 100% or 0% accuracy.
Hi there. Can you please provide some more information about your project? Things like, what kind of project are you trying to develop, what does this data represent, what have you tried on the studio so far, etc.
@sanieakhtar I’m sorry but I cannot share that. But I can tell you that my data is time series numeric data.
Please create a dummy project without you proprietary data that reproduces the issue and make the EI project public so we can see what you are seeing.
Can you share what kind of machine learning you’re trying to do on this data? What have you tried in the studio so far?
I’ve used Flatten(processing block) and Keras(learning block) in Creating an impulse.
I’ve made a copy of my project public for you to get a better understanding.
project id: 128553
Hi @Jainil_rao,
I cannot access 128553 to take a look at your data and model. Does the project still exist?
@shawn_edgeimpulse Yes, it still exists. I made the project public. Is there anything I can do to make it visible to you? If yes, then please tell me.
Hi @Jainil_rao,
Could you post a link to the public project?
@shawn_edgeimpulse I’m new to EDGE IMPULSE so I don’t know whether this is the correct link. Let me know what to do if this link is invalid.
Hi @Jainil_rao,
Thank you for the the project link. As @sanieakhtar mentioned, we would need to know more about what you are trying to do in order to assist you.
Right now, it looks like you have 2 very simple samples that consist of static values (inputs A, B, C, D, E, F, G). If you want to identify p vs. q, then you don’t even need a neural network, as all of your input values are static.
For example, I could create the simple test:
if A < 3000, label is p
otherwise, label is q
That would meet the criteria of identifying p vs q based on the training data you have provided.
If you are new to Edge Impulse and edge machine learning in general, I might recommend working through our course: https://www.coursera.org/learn/introduction-to-embedded-machine-learning. The course is free (but Coursera will give you pop-ups asking you to pay for a certificate–you can ignore those and simply continue with the free version of the course).
@shawn_edgeimpulse
Thank you for your response.
This is a time series data and is captured using a sensor (which I can’t share). Currently I have only two classes, but in future there will be some more classes with such numerical values.
What I’m trying to do is to predict the label for certain captured data.
I understand your point. But what if I have some more labels except P and Q? Such conditions would fail for those labels. I have data in this format only. Do you suggest machine learning for multiple labels?
Please let me know if there are any another alternative methods as well.
Thanks & regards.
I looked at your EI project and only see 2 data samples that will be used to train the Model. You should create 10’s if not 100’s or 1000’s of samples that will allow the Model to learn how class 'q' and class 'p' can vary.
You can add as many labels as you want. Machine learning works well for multiple labels.
For EI Studio to work with you time series data a timestamp must be added to your imported data.
For multi-axis, time-series data, the first column must be a timestamp. See here and here
1 Like
Hi @Jainil_rao,
To answer your question, machine learning might be a good solution, but without knowing your use case and the type of data you are working with, I cannot say for certain.
Do your inputs A-G change over time or will they always be static for each sample? If they change over time, what characterizes their dynamics–is it energy in certain frequency bands? If so, then you might want to use the Spectral Analysis block instead of Flatten. If the inputs are static, then you probably don’t need time series data: a single sampling of A-G might be enough to train a simple NN to identify your label.
Hope that helps!
@shawn_edgeimpulse
Hello Shawn, Greetings of the day.
Thank you for your response
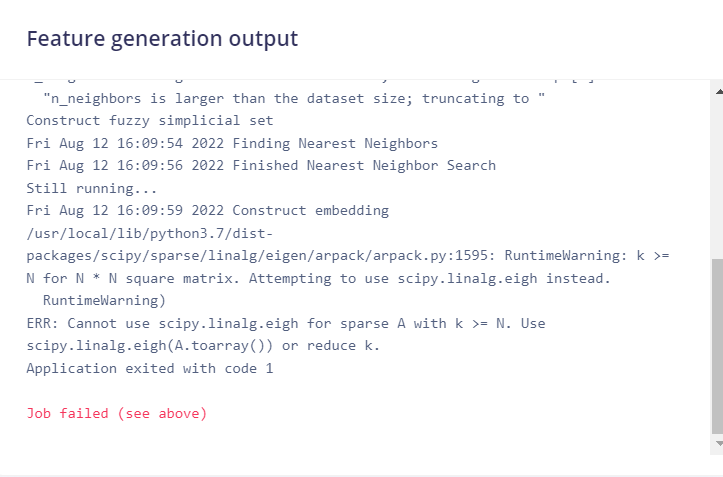
I added another label but the problem still exists. It still has 0% accuracy.
And it is displaying an error in spectral analysis. I’ve attached an image below for your reference.
Hi @Jainil_rao,
I checked your public project, and it still only has 2 labels (p and q), so I am unable to replicate the issue you are seeing. The spectral analysis block is best for extracting features that are repeating patterns (e.g. vibrations captured by an accelerometer). Based on the data you’ve shown me, it is probably not the best DSP block to use.
The error you are seeing shows that you need more samples so that the Nearest Neighbor algorithm will work.
@shawn_edgeimpulse
Greetings of the day!
I’ve updated the 3rd label. Here’s a link to that: New project - Dashboard - Edge Impulse
And my data file already has around 80 rows in training and 20 rows in testing. How do I add more samples? Do I add more rows to my data file?
Hello @MMarcial ,
Just saw your reply.
Thank you for your response!
My data file already contains around 100 rows(training + testing). And it contains timestamp as well.
RE: My data file already contains around 100 rows(training + testing).
Each row needs to be in a separate file when uploaded.
RE: Timestamps
When I download the data I do not see a Timestamp in the JSON file.
My Try
- I arbitrarily split your data into 10ms samples
- I changed the Impulse design
- Time Series Data →
Window Size = 10ms
- Time Series Data →
Window Increase = 2ms
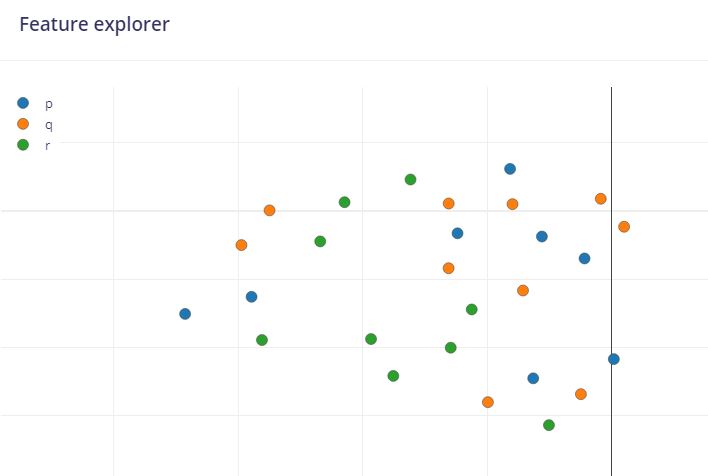
- The Model did get trained with poor accuracy since Feature Explorer could not group the data. So my guess at splitting the data into 10ms samples is wrong.
1 Like