I noticeed points representing some images in my object deetection project are at the position 0,0 in the 3D plot. Is this because of a bug or has special meaning ? The same photos in a previous version with less categories were not in the (0,0) position.

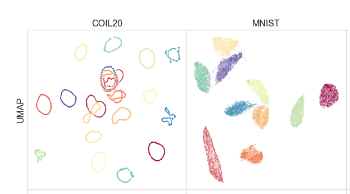
Also, I am interested to know your thoughts about how far I can get benifit from the “Feature explorer” to reduce the anomolies in my object detection dataset. I know that this feature is based on UMAP algorithm which reduces the data dimentionality, and the orginal paper showed how MNIST was nicly clustered to 10 clusters (image bellow). This should be very similar to any calssification problem. But, in object detection problem (which part of it is a classification), each image has many objects inside not only one so could that be really nicly clusstered using UMAP or even close?