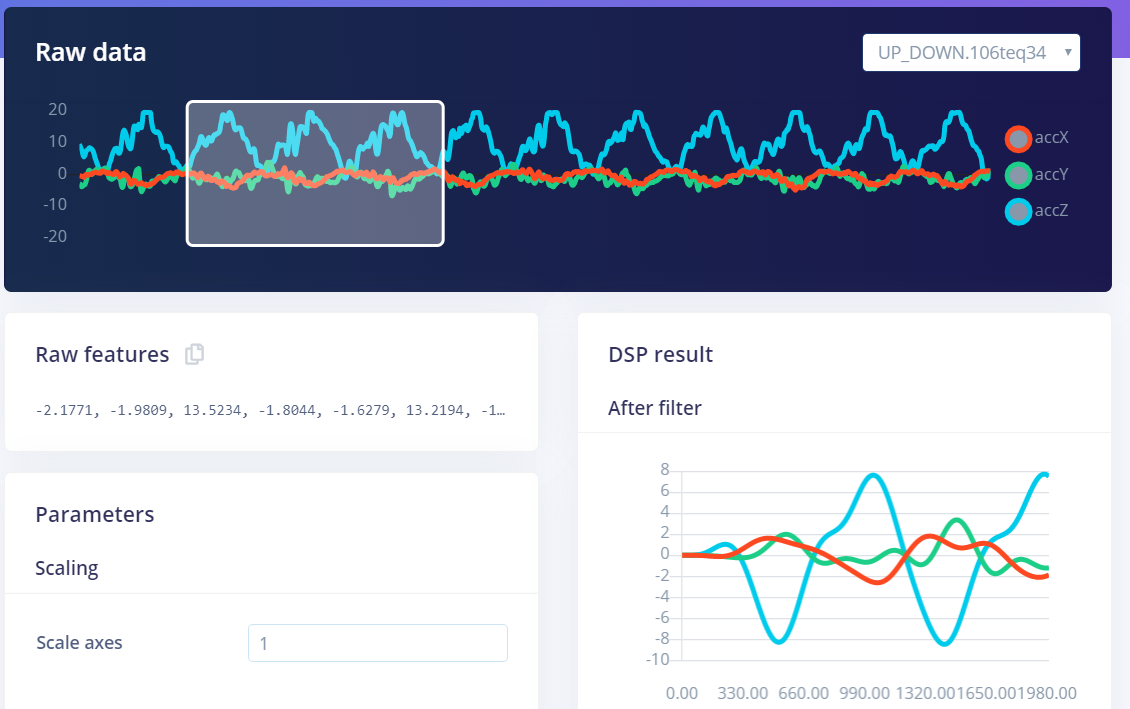
I don’t get why the signal plotted in the after filter section doesn’t correspond to the signal appearing in the window on top if the signal was just filtered.
Hi @doliprane, that indeed doesn’t look good. Almost like the DSP request did not succeed (it’s a separate HTTP call). Could you see if you see any errors in the browser console?
@janjongboom I can’t seem to find errors in the console. There’s only a warning that I don’t think is relevant to the problem.
![]()
@doliprane, If you switch the sample with the dropdown box on the right top corner of the graph, does it change?

@janjongboom I think it’s the same thing. I don’t know what transformation has been applied to the signal but the visualized dimensions in the plot always start at 0.
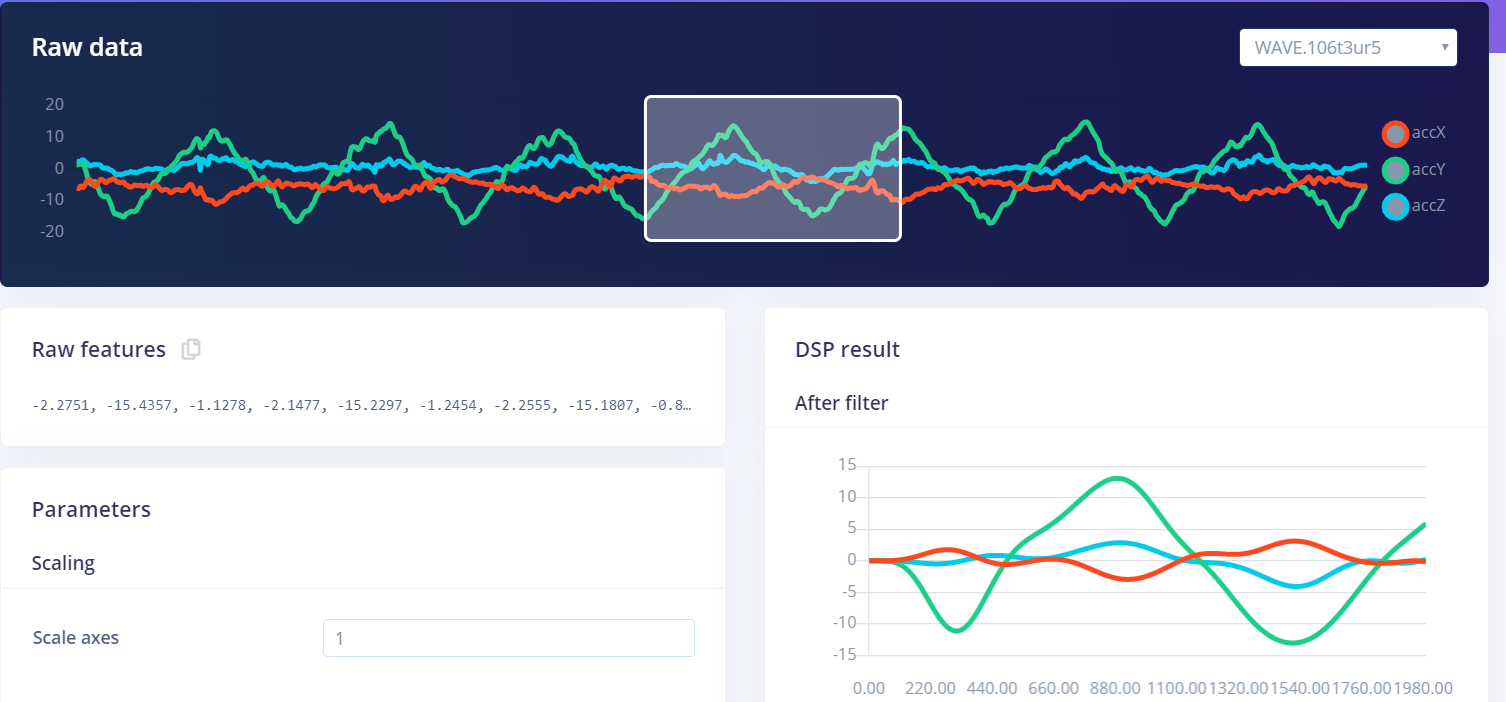
@doliprane, hm… You’re on Chrome? Does the ‘Raw features’ text box get updated if you move the window?
@janjongboom I think the raw features are working fine. I visualized a bunch of them and it looks just like the one on top in the windows. I just don’t know what transformations are happening to the signal besides the filter in order to get the after filter signal.