Hello all,
is there a way to copy the values from the dots that shows the Data Explorer plot?
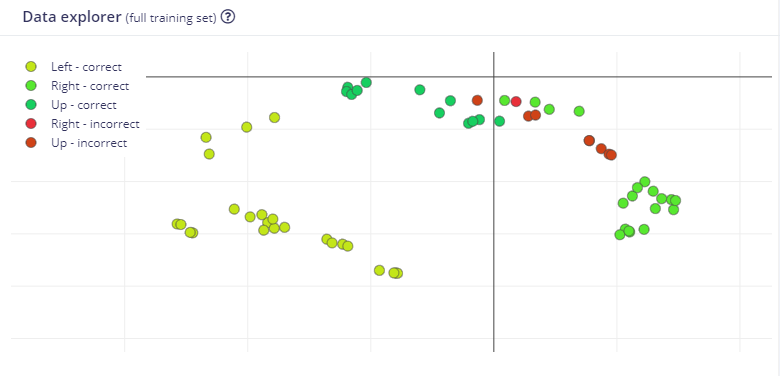
I want to replicate this plot maybe in python or matlab.
Thanks!
Hello all,
is there a way to copy the values from the dots that shows the Data Explorer plot?
I want to replicate this plot maybe in python or matlab.
Thanks!
Hi @ErickGQ,
This is not something available but you could replicate something similar following our documentation: Data explorer - Edge Impulse Documentation.
You can already download the output of the DSP block as a numpy array from your project’s dashboard.
Aurelien
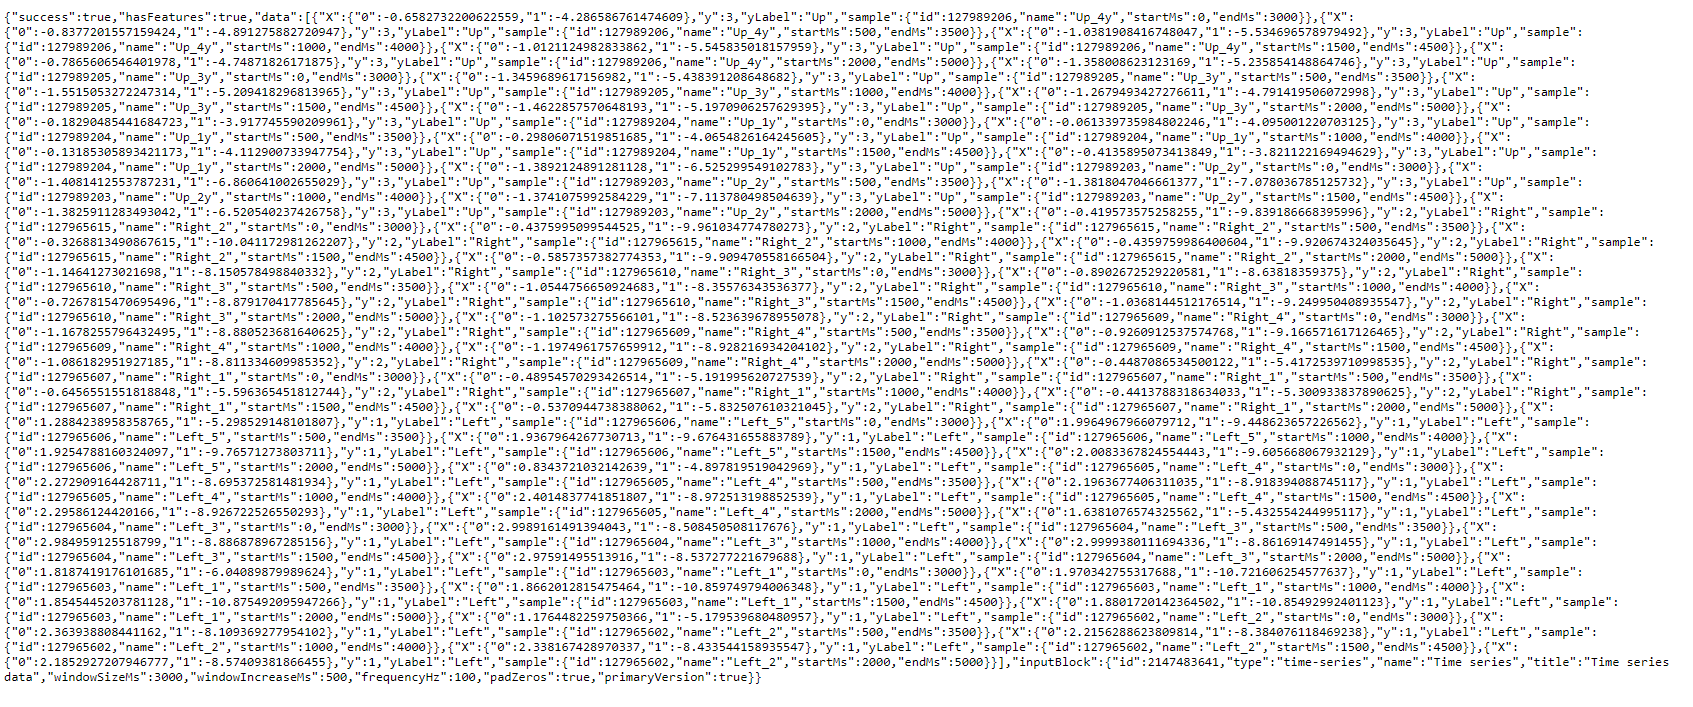
@ErickGQ If you just want to replicate the plot you can fetch the data via:
https://studio.edgeimpulse.com/v1/api/{projectId}/raw-data/data-explorer/features
The data array has features in X, predicted label index in y; actual label (as string, bit confusing I know  ) in
) in yLabel. Throw this in a scatter2d plot and you should get the same as ^.
I tried:
ProjectId: 129170
and
ProjectId: 134024
with the browser returning just JSON.
{
* "success": true,
* "hasFeatures": false,
* "data": []
}
Where’s the data?
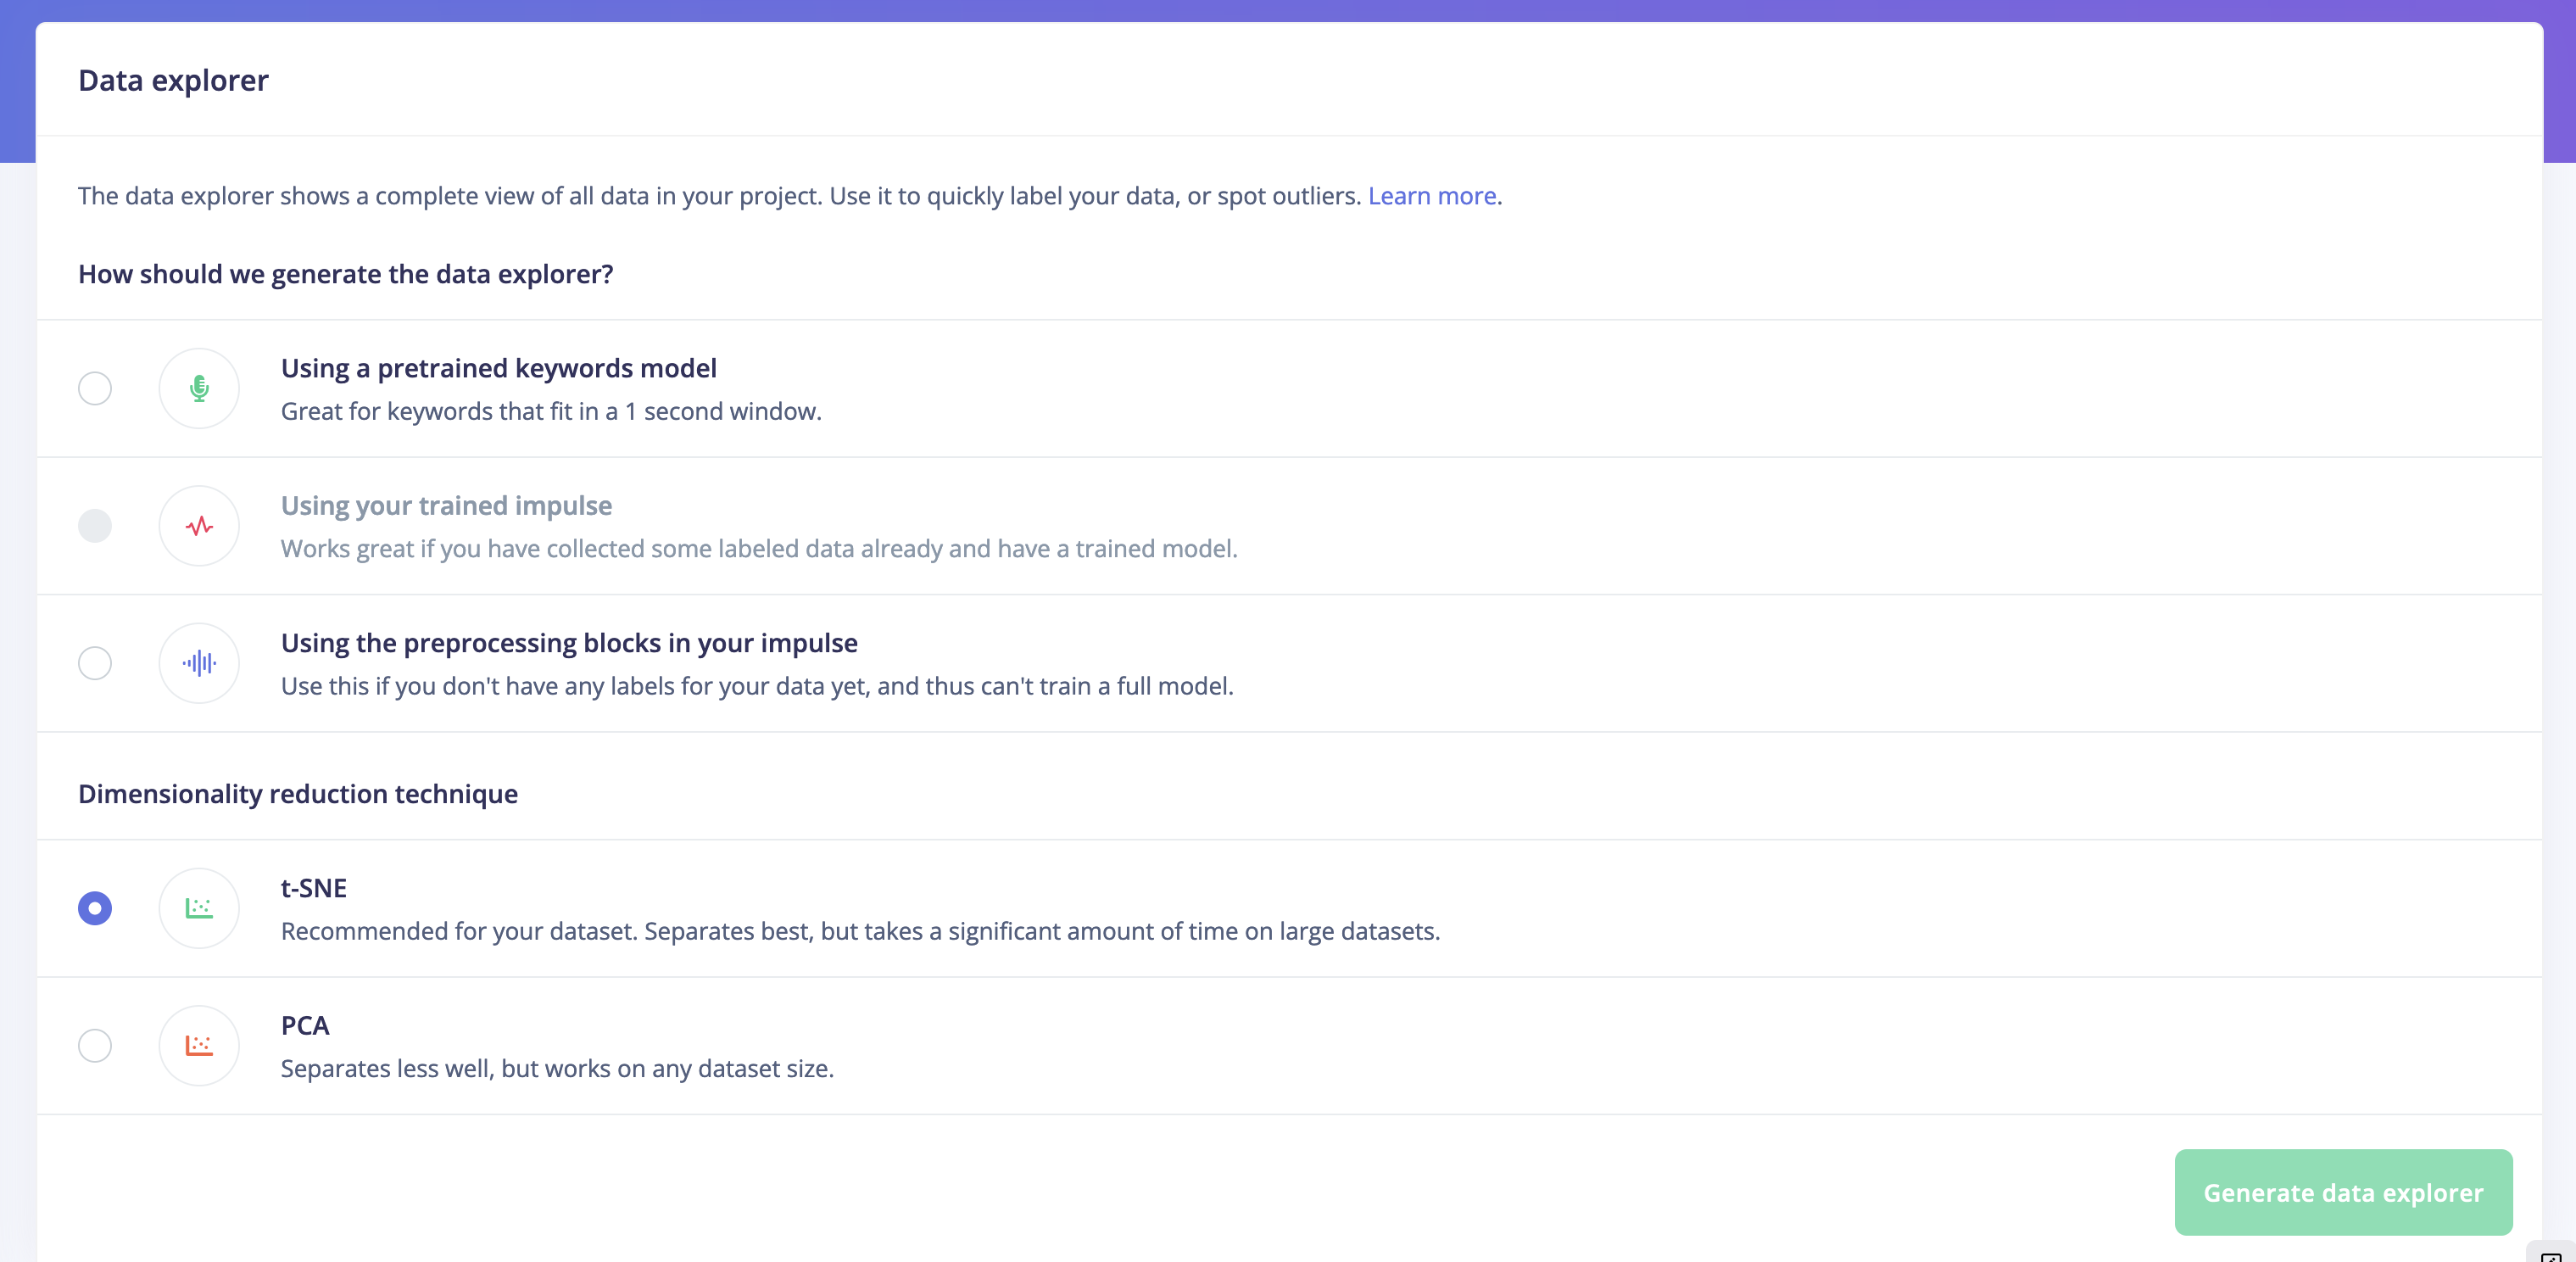
@MMarcial You first need to generate the data explorer features. Easiest is through the UI:
(Alternatively via the generateDataExplorerFeatures API call here).
Hi,
this works for me
I used the next link, just changed the part {projectId} for my project number, in my case 128963, so the final link is the second line
https://studio.edgeimpulse.com/v1/api/{projectId}/raw-data/data-explorer/features
https://studio.edgeimpulse.com/v1/api/128963/raw-data/data-explorer/features
My results looks like the next picture
Thank you very much!