Deployed WebAssembly build gives different outcome compared to my edge impulse dashboard

I have deployed (unoptimized version) of my WebAssembly build to my intel nuc device.
When I compare the outcome of my test data I am getting different results.

E.g.

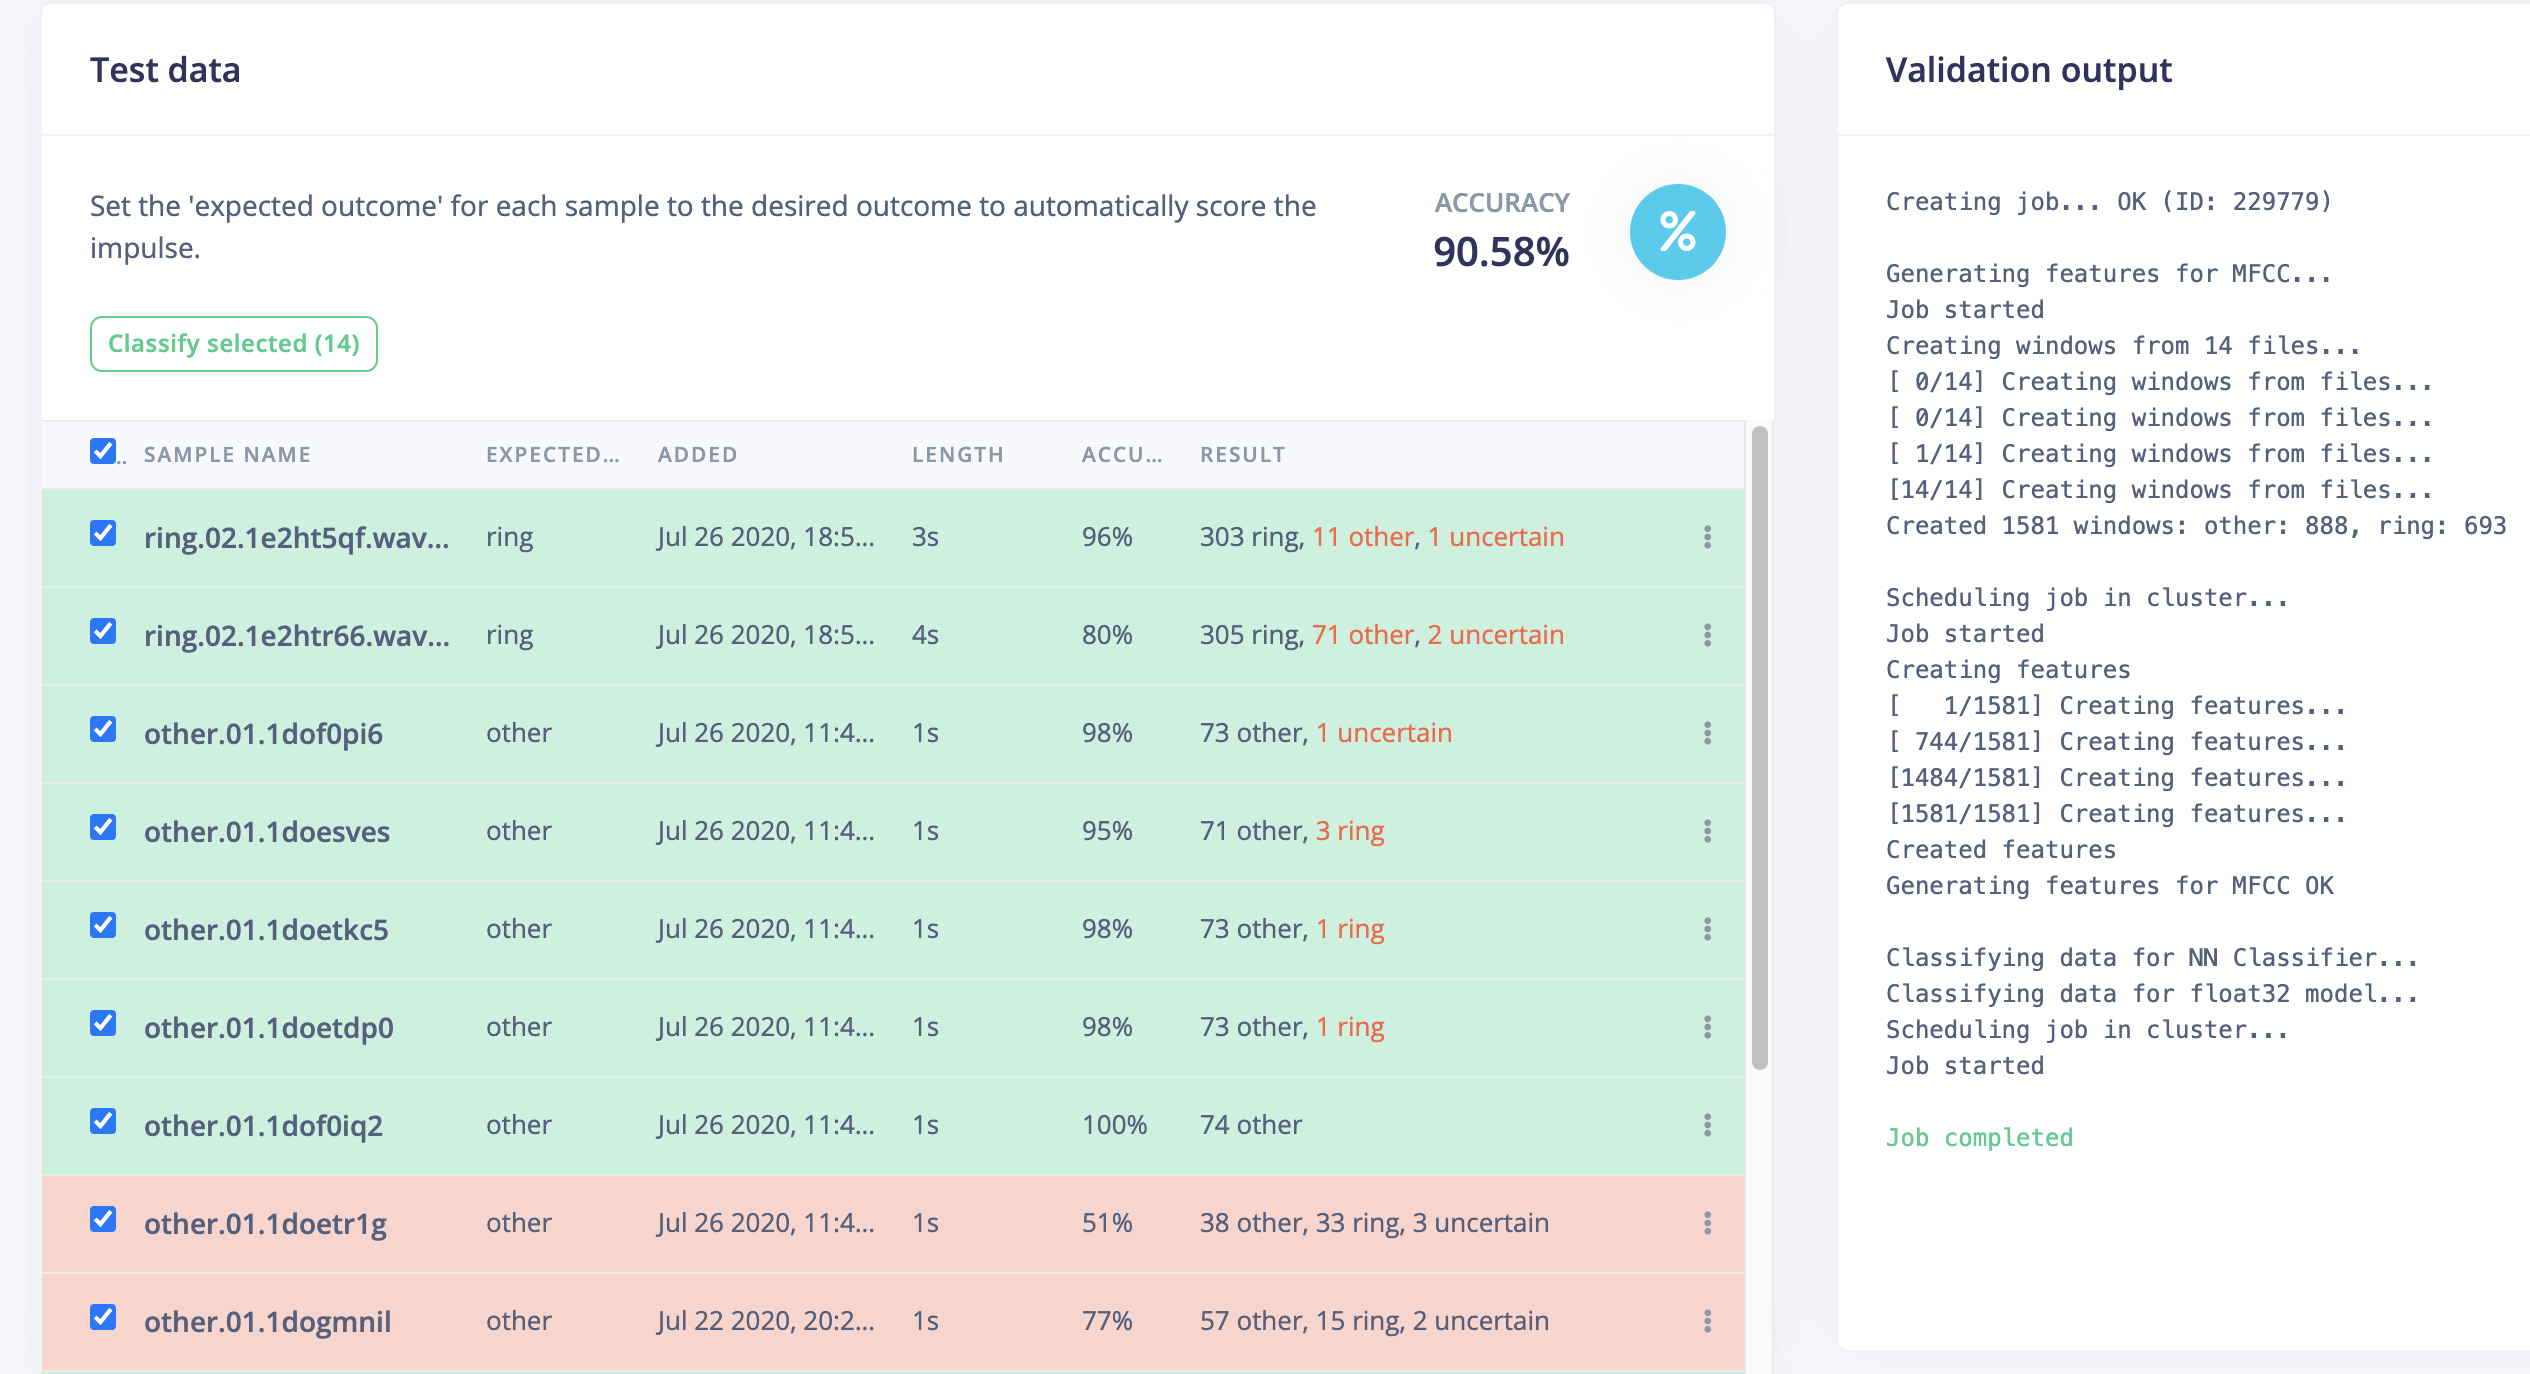
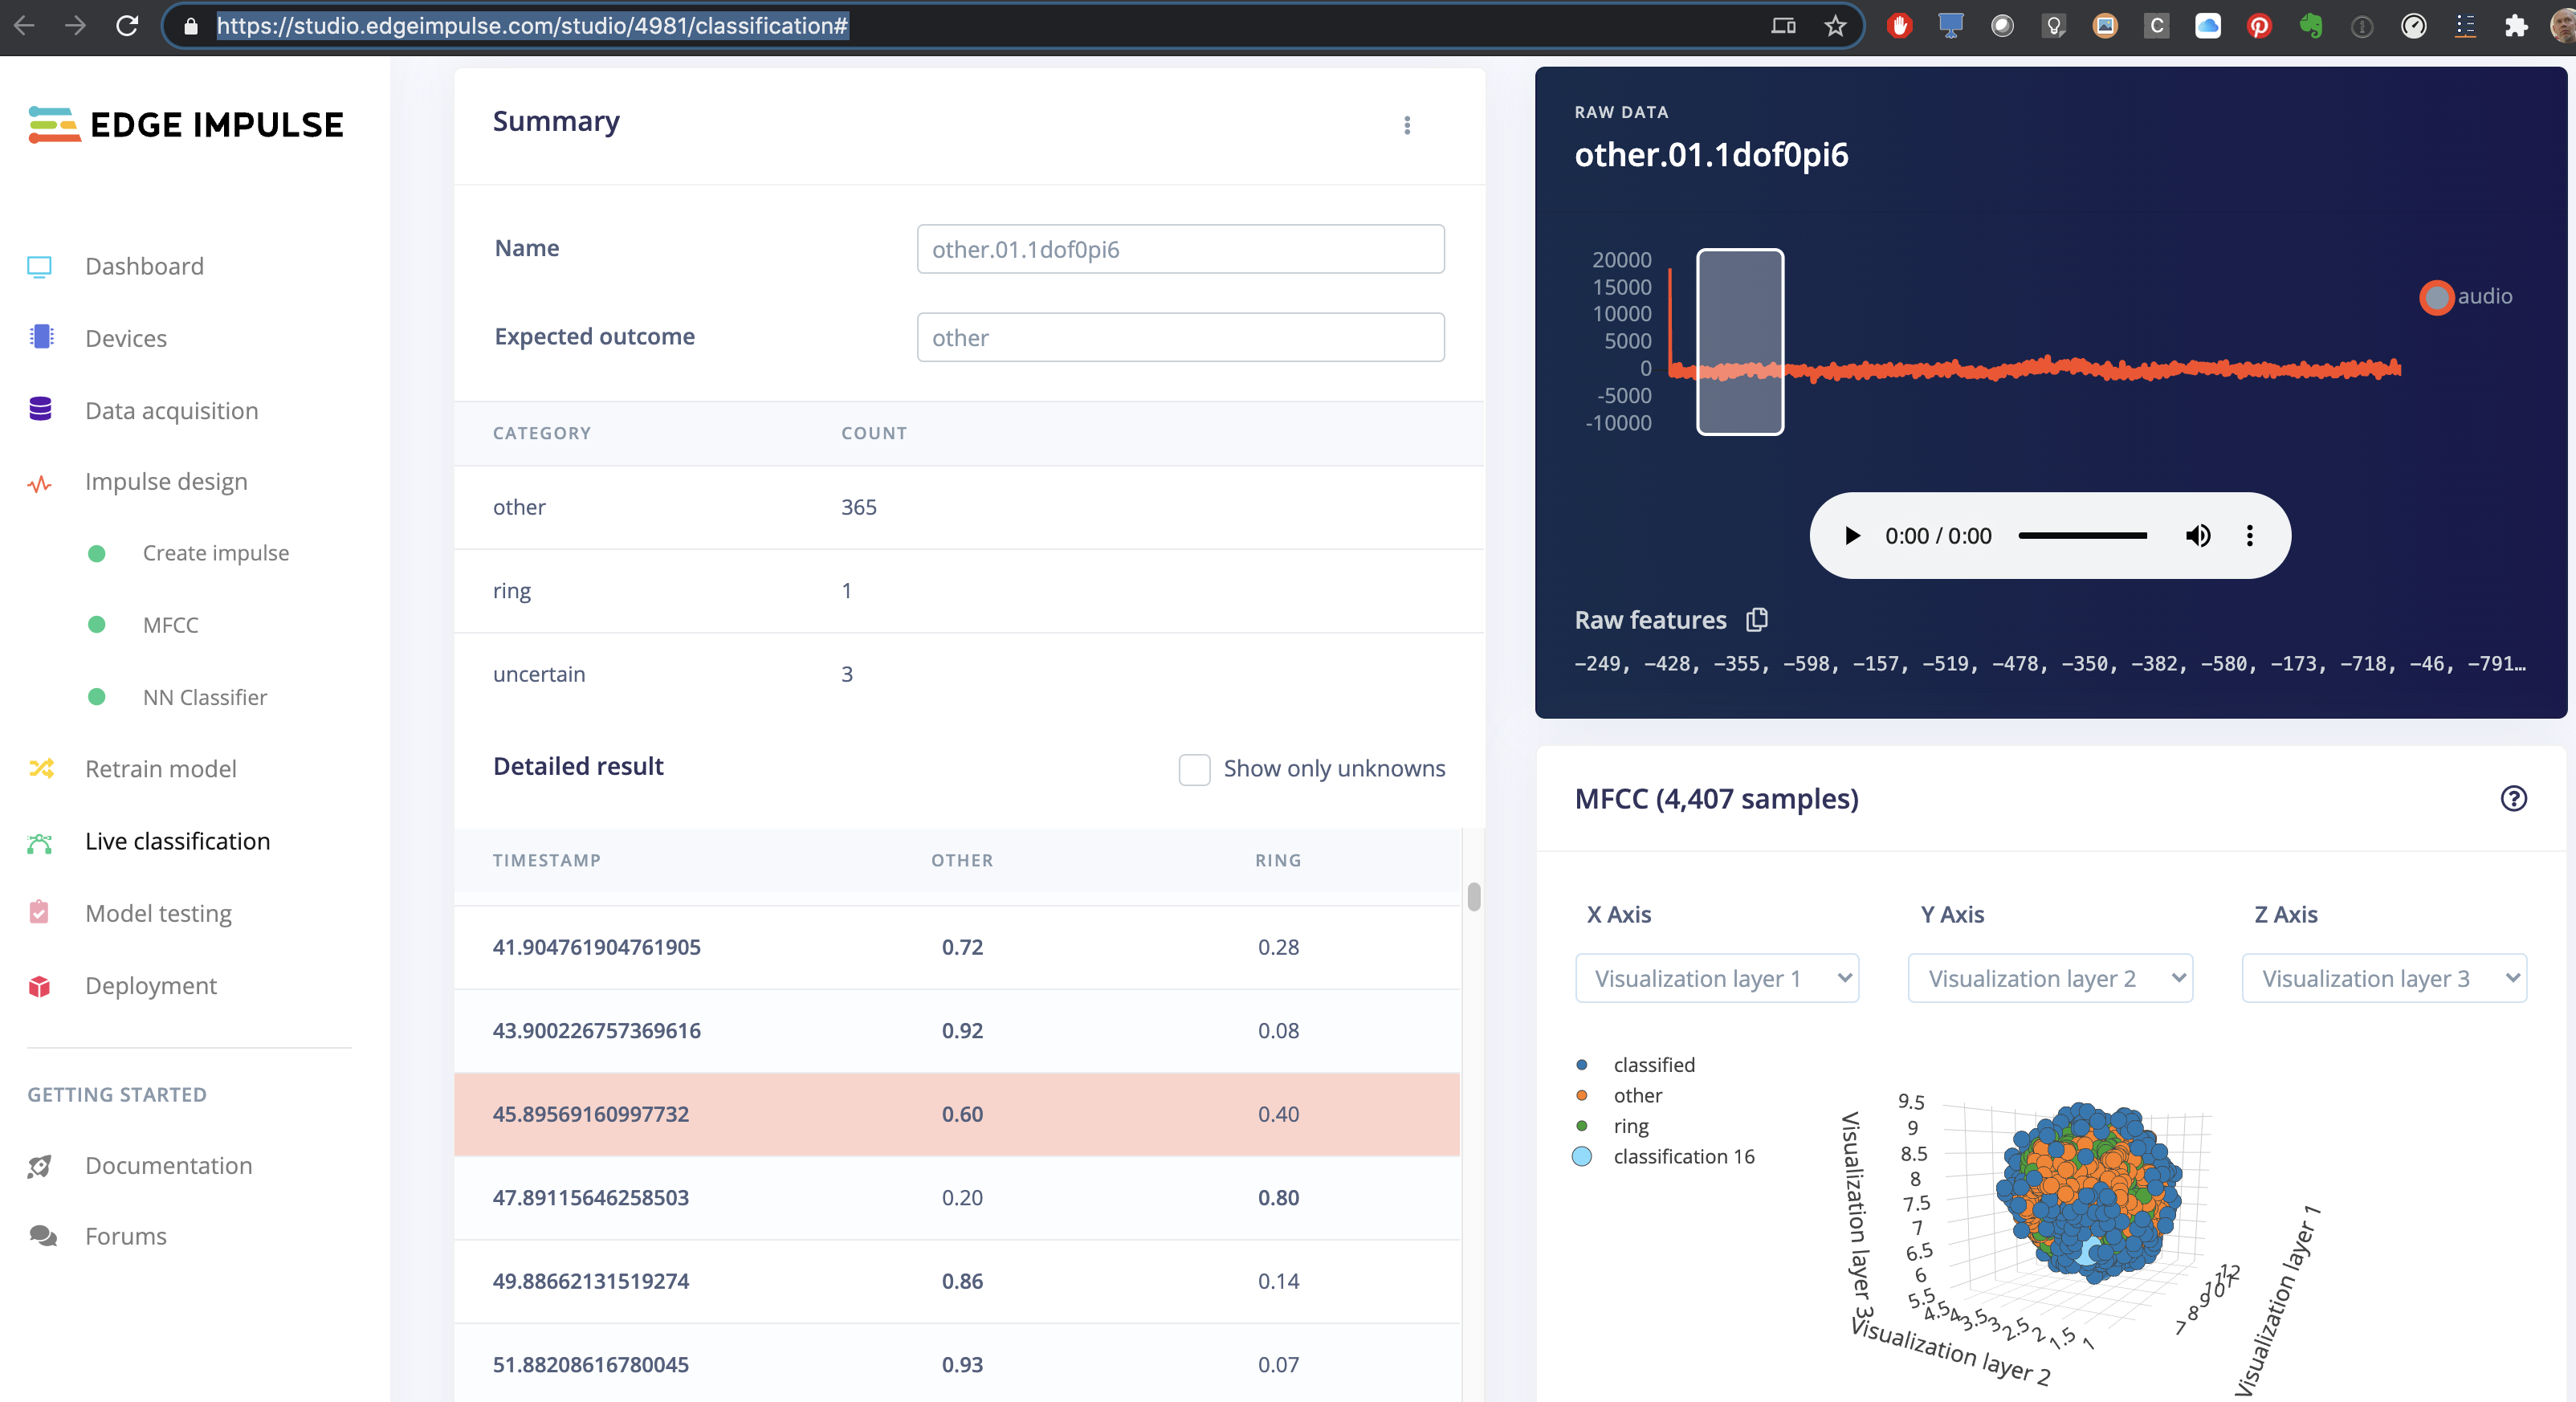
Sample 16 of other.01.1dof0pi6 gives as classification:

  • other = 0.60
  • ring = 0.40.

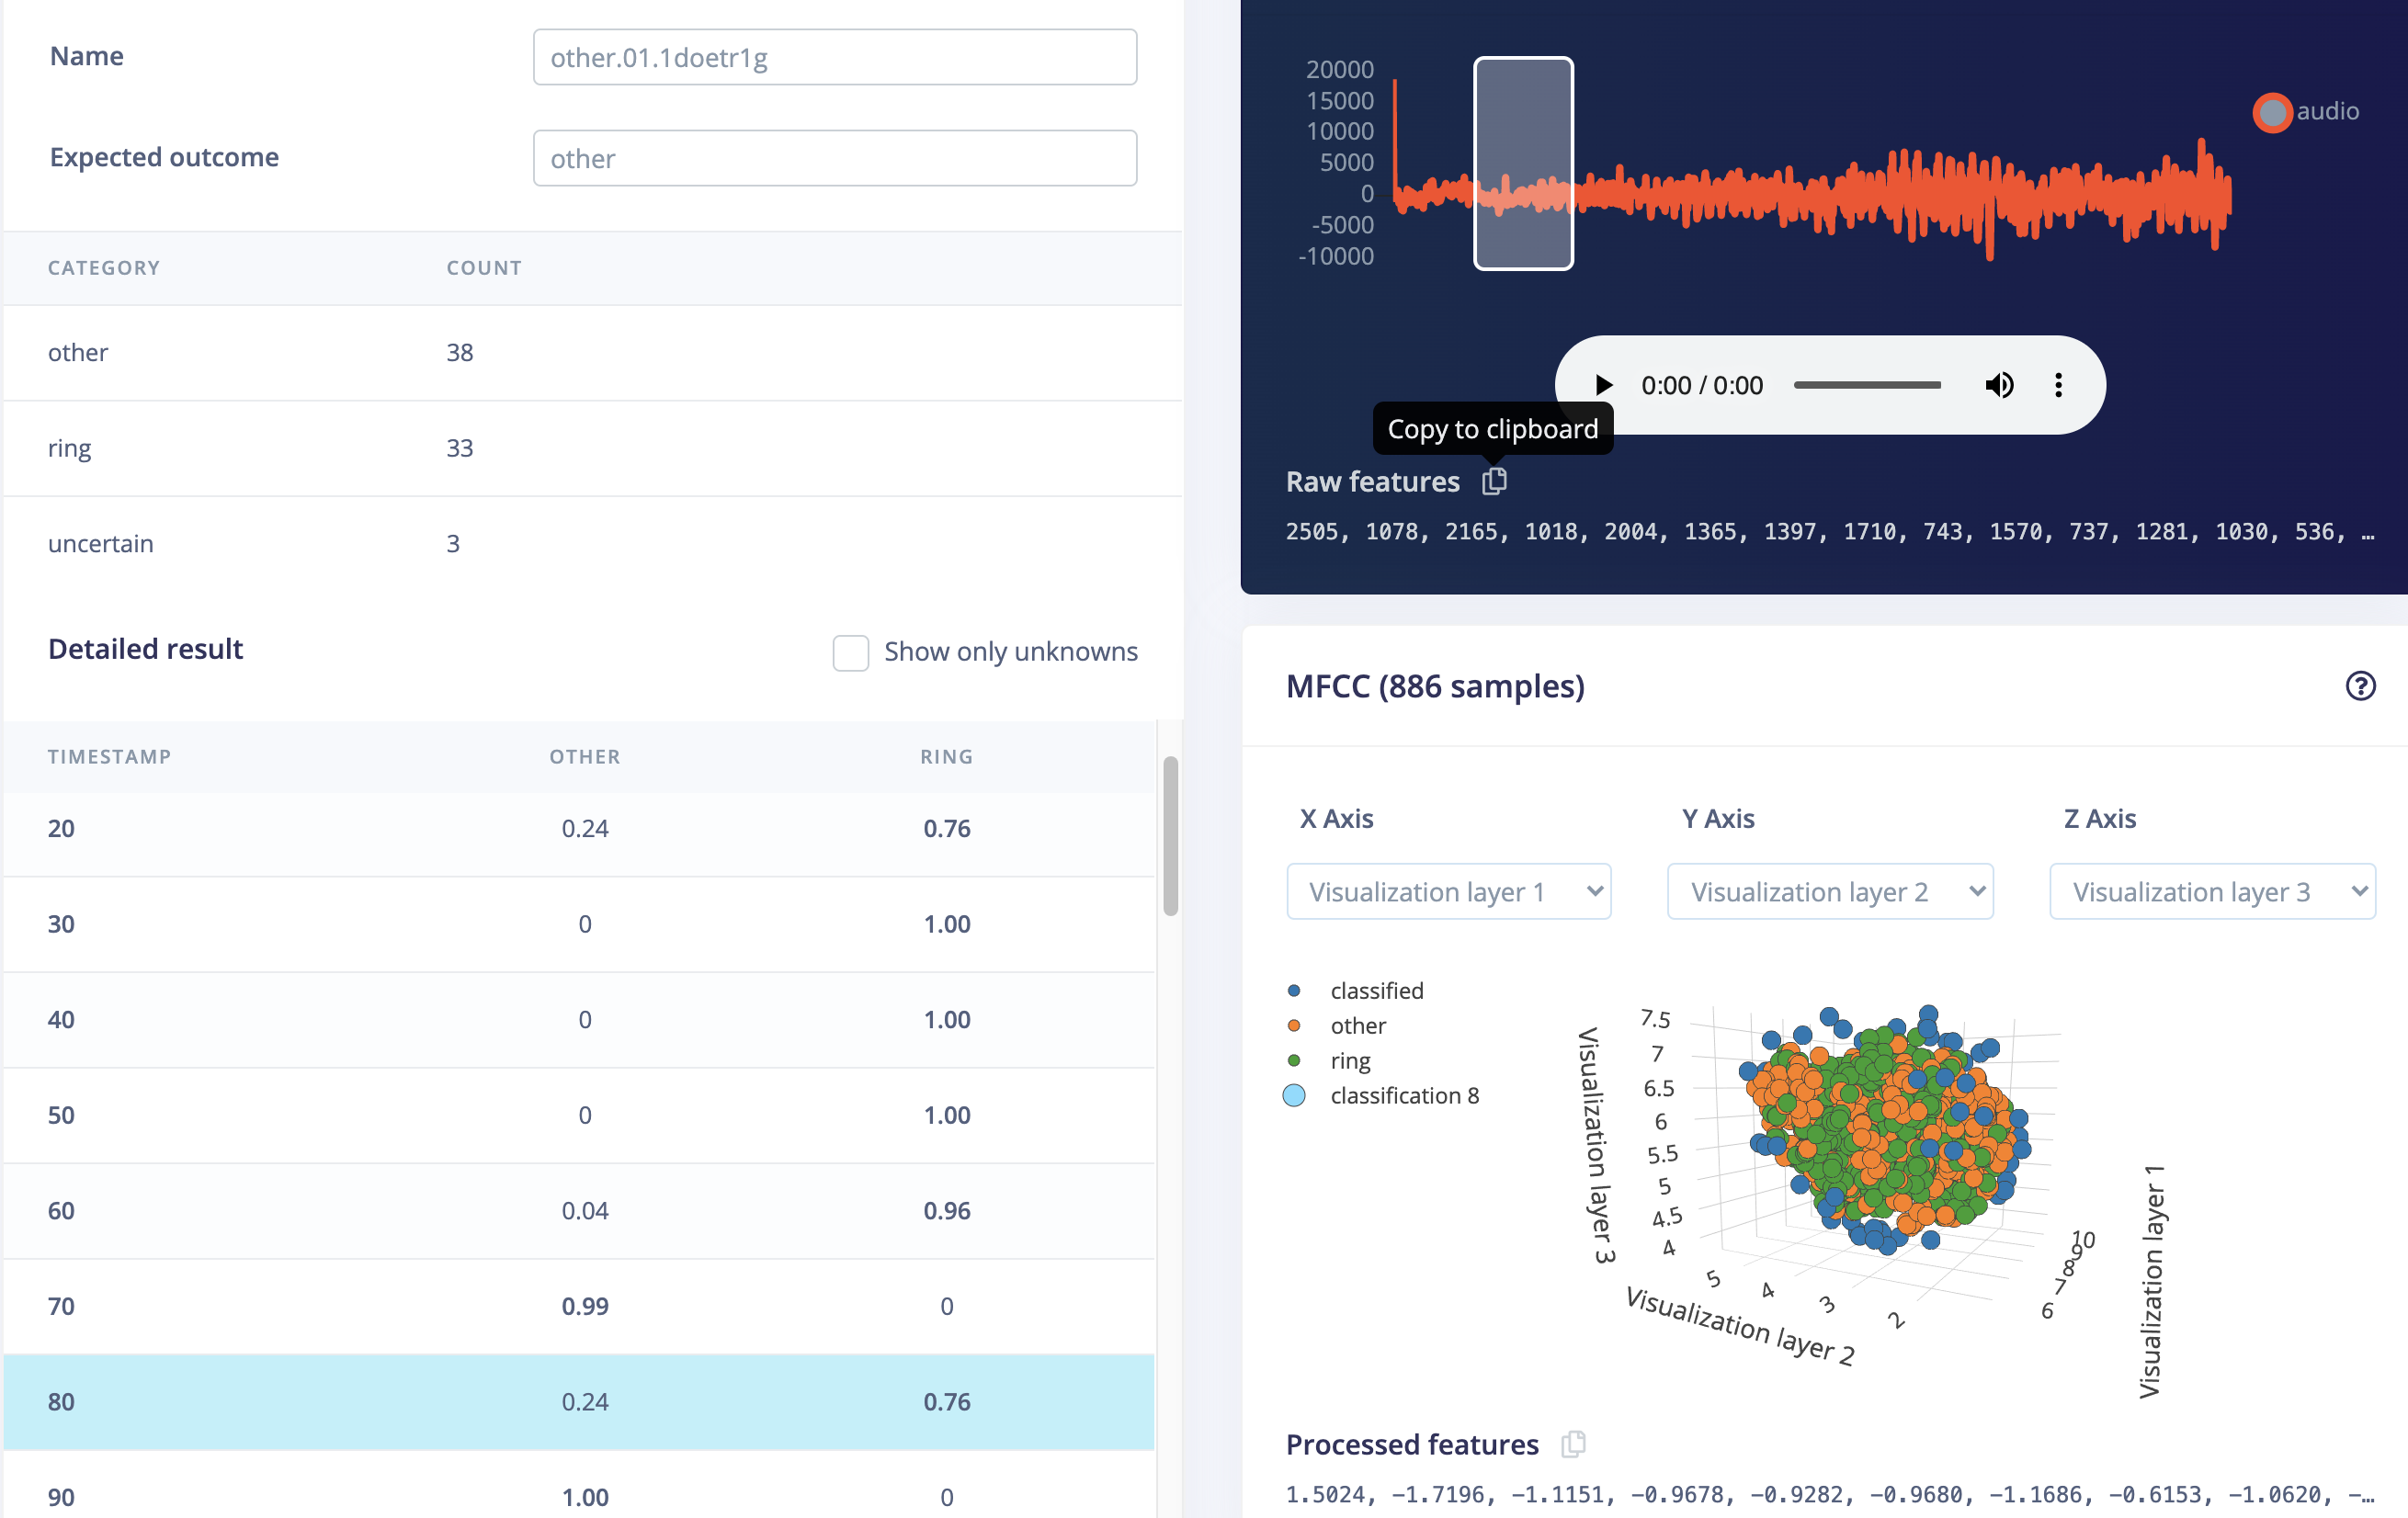
When I copy the raw features and run the same classification on my intel-nuc I am getting a different result:

bash-5.0$ node run-impulse.js "-249, -428, -355, -598, -157, -519, -478, -350, -382, -580, -173, -718, -46, -791, -351, -229, -691, -593, 10, -710, -532, -227, -524, -315, -572, 154, -1141, 359, -1197, 364, -1074, 27, -646, -234, -379, -722, 214, -1428, 719, -1471, 385, -1025, 75, -666, -254, -490,-270, -488, -506, -29, -756, -58, -810, 273, -919, -397, -189, -455, -919, 223, -1155, 1, -436, -426, -827, 404, -1095, -218, 50, -1182, 595, -1326, 679, -1748, 850, -1210, -204, -138, -843, 96, -682, -232, -734, 131, -1002, 78, -848, -3, -867, 254, -1040, 64, -533, -453, -121, -708, -250, -518, 11, -1022, 183, -966, 112, -1024, 261, -1113, 97, -627, -265, -546, -282, -398, -652, 114, -1267, 430, -1300, 571, -1593, 718, -1249, -66, -515, -599, -183, -674, -73, -900, -92, -634, -148, -1081, 268, -1143, 84, -849, 101, -1301, 397, -751, -649, -50, -802, -198, -533, -381, -662, -26, -685, -252, -722, 70, -956, 249, -1089, 399, -1076, -1, -348, -624, -179, -567, -133, -1011, 77, -650, -304, -663, 270, -1445, 469, -736, -556, -194, -355, -449, -402, -167, -856, 108, -684, -184, -725, -101, -600, -521, -99, -756, -411, 26, -1078, -85, -488, -438, -420, -355, -450, -423, -393, -409, -107, -1284
..., -645, 600, -131, -44, 150, 21, 167, -88, 423, -266, 52, 728, -1226, 1175, -626, 295, 15, -10, 163, -406, 1009, -939, 779, -324, 372, -389, 590, -548, 506, 121, -403, 596, -157, -84, 354, 256, -862, 1209, -644, 185, 150, 153, -325, 670, -283, 5, 425, -100, -13, 279, 102, -587, 1329, -1287, 831, -205, 252, -176, 40, 538, -851, 1091, -580, 115, 290, -299, 266, 133, -191, 142, 209, -35, -310, 782, -810, 760, -236, -3, 177, -236, 471, -611, 670, -563, 858, -835, 622, -245, 65, 151, -55, 285, -372, 544, -311, 88, -90, 483, -691, 767, -667, 416, -62, 104, -52, -111, 452, -684, 971, -1059, 1006, -516, 226, 23, -247, 419, -430, 555, -655, 668, -567, 388, -139, -196, 125, 144, -336, 107, -92, -112, 509, -772, 868, -577, 271, -86, 210, -389, 380, -22, -198, 218, -264, 293, -205, 465, -744, 539, 230, -310, -56, 749, -846, 413, 104, -272, 11, 377, -178, -128, 420, -696, 814, -647, 638, -799, 805, -314, -410, 752, -687, 465, -129, 12, -35, 263, -137, 114, 10, -28, 133, -43, -97, 147, -63, -36, -59, 373, -528, 683, -297, -52, 447, -680, 887, -731, 503, -311, 345"
{
  anomaly: 0,
  results: [
    { label: 'other', value: 1 },
    { label: 'ring', value: 2.105216445613678e-9 }
  ]
}
bash-5.0$

@janvda Indeed looks like a bug between the Python code and the C++ code that we emit in the MFCC block (I see some different features being generated). Looking at it now.

1 Like

OK so took a quick look, and the underlying issue is that one of the MFE columns is close to zero and our Python and C++ implementations round this differently. Afterwards we call log() over this which makes the error a lot worse, and then culminates into wrongly generated features. Filed a bug internally.

Also, I see there’s a bug in the live classification view where we keep loading other rows when the timestamp is not a round number (normally not a problem because most audio data is 16KHz and that’s easily divisable, but 44.1KHz as in your dataset is a bit harder). Thus I don’t completely trust the raw data field there at all times.

Fortunately we can work around this:

  1. Set your window increase to 10 (as 44100/10 is an integer).
  2. Set your lower frequency in the MFCC block to 1000 (to avoid the MFE column that’s close to 0).
  3. Use the following neural network settings:

  1. This yields similar results to your current model (92% on the test set), and the WASM export works well (might be a few percentage points off due to the bug earlier, but generally very close).

The underlying issues are filed internally.

2 Likes

Thanks for looking into this.
I will change it based on your suggestion.

For the record:

With the current settings

  • window increase = 2 ms
  • lower frequency in the MFCC block = 300
  • my NN settings:

I am getting following results:

With the proposed settings:

just tested it and the difference indeed appears to be small:

Running a copy of same raw feature on my nuc-jan of deployed (unoptimized) build gives:

1, -2767, -1903, -1332, -1889, -1091, -1887, -304, -2041, 159, -1656, -310, -548, -757, -491, -1494, -233, -1773, -819, -1453, -1193, -1188, -1673, -1366, -1335, -1735, -1744, -1684, -2199, -1400, -2104, -1796, -1941, -1895, -2886, -1398, -2153, -2548, -1781, -2375, -1812, -2422, -1844, -1417, -1241, -2121, -961, -1403, -1195, -1293, -832, -1403, -602, -990, -944, -308, -652, -65, -1113, 137, -1225, -204, -755, -341, -195, 71, 220, -278, 253, -629, 89, -811, -748, -942, -807, -1179, -863, -1158, -1400, -1029, -1756, -1200, -1804, -1473, -1527, -1565, -2027, -1202, -1478, -1518, -956, -1923, -369, -2043, -1042, -1903, -1389, -1552, -2019, -1216, -2000, -1151, -2160, -764, -1746, -692, -1867, -1000, -547, -1090, -76, -173, -117, -268, 610, -359, 678, 186, -263, 230, 269, -662, -247, -649, -1115, -701, -677, -1055, -698, -1253, -1120, -595, -1712, -682, -1333, -1216, -795, -1231, -625, -1355, -914, -1375, -1334, -1123, -1930, -507, -1734, -700, -1321, -564, -1347, -1041, -696, -1674, -715, -1893, -553, -1715, -1066, -1220, -1065, -1159,-962"
{
  anomaly: 0,
  results: [
    { label: 'other', value: 0.2806724011898041 },
    { label: 'ring', value: 0.7193275690078735 }
  ]
}
bash-5.0$

So there is still difference (as you mentioned) but it is rather small: 0.24 versus 0.2806724.