Hello,
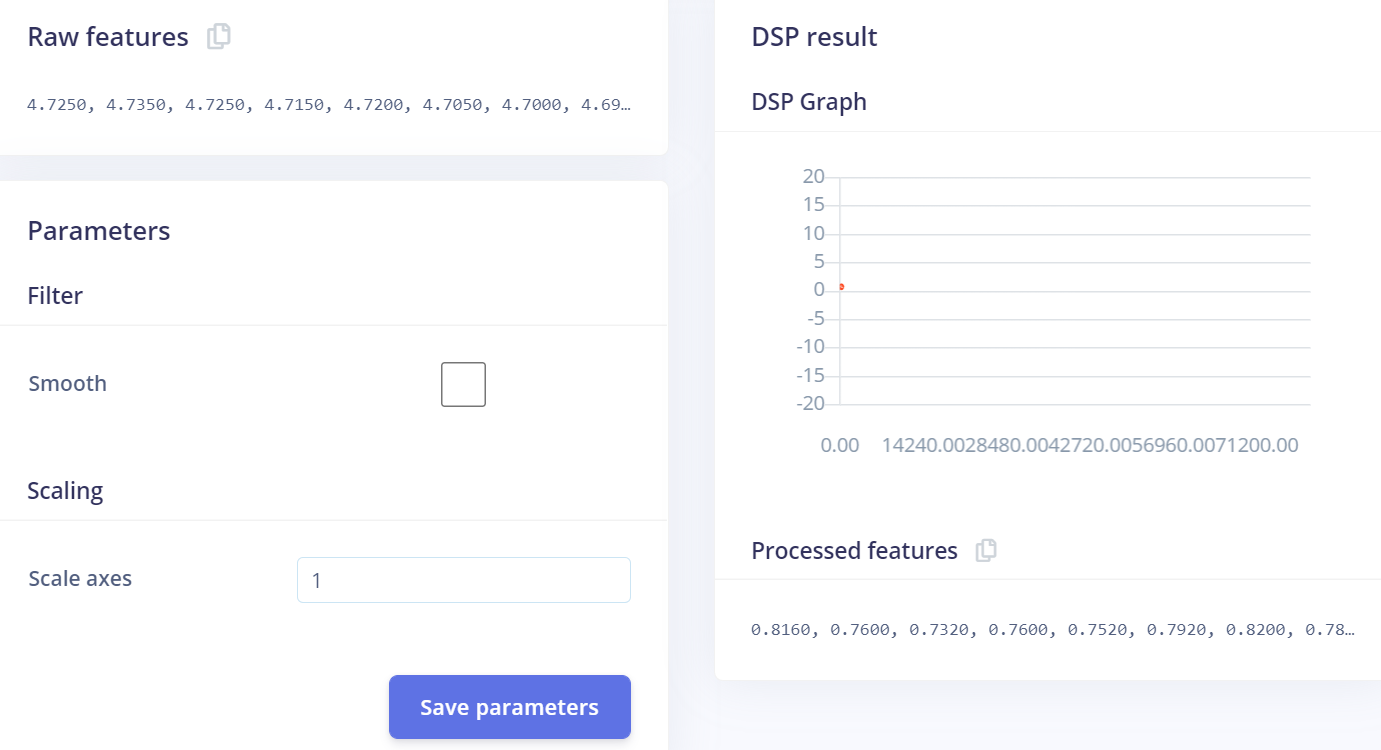
I am trying to extract RR intervals as features from an ECG dataset. Everything seems ok in the first custom block view, but when I try to generate features I got this error:
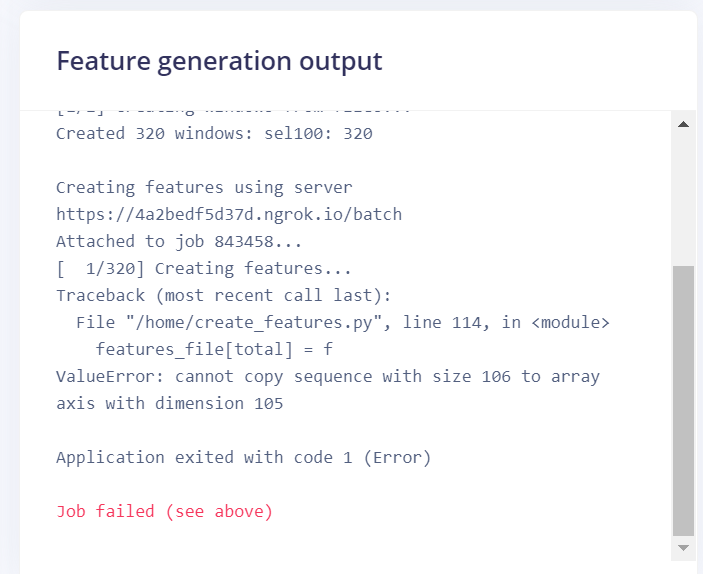
This is the dsp.py code I used:
import numpy as np

from hrvanalysis import remove_outliers, remove_ectopic_beats, interpolate_nan_values

from hrvanalysis import get_time_domain_features

from hrvanalysis import get_nn_intervals

import json

import peakutils

def smoothing(y, box_pts):

    box = np.ones(box_pts) / box_pts

    y_smooth = np.convolve(y, box, mode='same')

    return y_smooth

# define hrv - da MainCodeYT *Angelo

def hrv(data, fs):

    # find peaks

    r_peaks = peakutils.indexes(data, thres=0.5, min_dist=0.1)

    # RR intervals

    RR_intervals = np.diff(r_peaks)/fs

    return RR_intervals

def generate_features(draw_graphs, raw_data, axes, sampling_freq, scale_axes, smooth):

    # features is a 1D array, reshape so we have a matrix with one raw per axis

    raw_data = raw_data.reshape(int(len(raw_data) / len(axes)), len(axes))

    features = []

    smoothed_graph = {}

    # split out the data from all axes

    for ax in range(0, len(axes)):

        X = []


        for ix in range(0, raw_data.shape[0]):

            X.append(raw_data[ix][ax])

        # X now contains only the current axis

        fx = np.array(X)

        # first scale the values

        fx = fx * scale_axes

        # if smoothing is enabled, do that

        if (smooth):

            fx = smoothing(fx, 5)

        # extract features from fx *Angelo

        fx = hrv(fx, sampling_freq)

        # we save bandwidth by only drawing graphs when needed

        if (draw_graphs):

            smoothed_graph[axes[ax]] = list(fx)

        # we need to return a 1D array again, so flatten here again

        for f in fx:

            features.append(f)

    # draw the graph with time in the window on the Y axis, and the values on the X axes

    # note that the 'suggestedYMin/suggestedYMax' names are incorrect, they describe

    # the min/max of the X axis

    graphs = []

    if (draw_graphs):

        graphs.append({

            'name': 'DSP Graph',

            'X': smoothed_graph,

            'y': np.linspace(0.0, raw_data.shape[0] * (1 / sampling_freq) * 1000, raw_data.shape[0] + 1).tolist(),

            #'y': np.linspace(0.0, 5, 1).tolist(),

            'suggestedYMin': -20,

            'suggestedYMax': 20

        })

    return { 'features': features, 'graphs': graphs }
The dsp-server.py code I used is the one given here https://docs.edgeimpulse.com/docs/custom-blocks.
The CSV input file is this:
timestamp,ECG
0,4.725
4,4.735
8,4.725
12,4.715
16,4.72
…
399996,4.765
Anyone could help me with this problem?
Thanks,
Angelo