Hello!
I was trying to add a custom process block and changed the code based on the python example mentioned in the tutorial: https://docs.edgeimpulse.com/docs/custom-blocks. In the adding graph code in dsp.py, it seems that ‘X’ defines the y-axis values to plot and ‘y’ defines the x-axis points. Also suggestedYMin’ defines the y-axis range and ‘suggestedXMin’ defines the x-axis range to plot. Is there a specific reason that it’s set this way or should it be reversed? Thanks a lot!
All the best,
Ran
Hey @rwang0417, sorry your post was hidden by the spam system. I’m looking at it again now, but this seems correct?
graphs.append({
        'name': 'Logarithmic example',
        'X': {
            'Axis title': [ pow(10, i) for i in range(10) ]
        },
        'y': np.linspace(0, 10, 10).tolist(),
        'suggestedXMin': 0,
        'suggestedXMax': 10,
        'suggestedYMin': 0,
        'suggestedYMax': 1e+10,
        'type': 'logarithmic'
    })
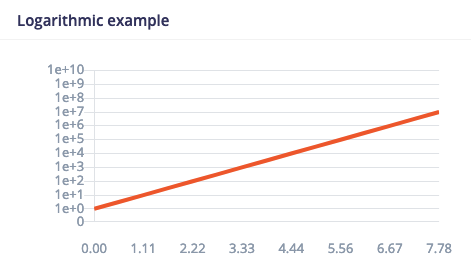
Here the X axis runs from 0…10 (sort of, it seems to stop a bit earlier, but that’s another story) and Y axis runs from 0…1e+10.
Thanks a lot for your time! Now I get it. The x and y limit I set were similar and confused myself.
All the best,
Ran