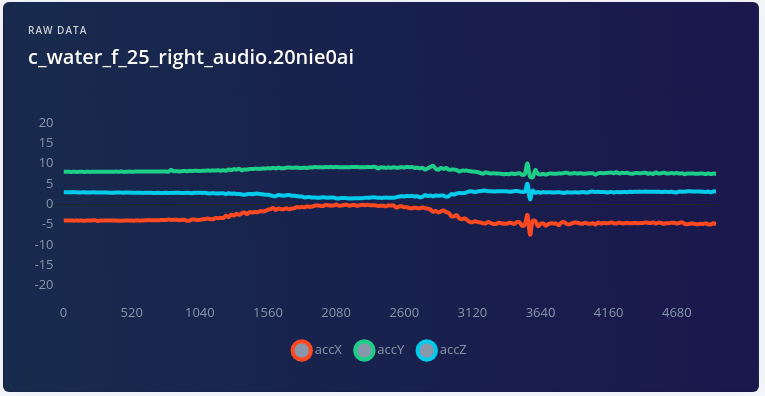
In this screenshot, I know that the graph’s X-axis is time but was wondering what the Y-axis is for both accelerometer and audio samples.
Hi @Doc_Monster7,
Y-axis is the amplitude of the signal, usually in m/s² for accelerometer, and integer values for audio with a range correlated to the bit-depth (16 bits being common).
Aurelien
1 Like
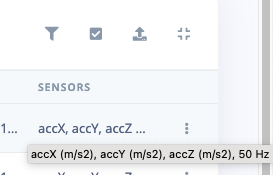
FYI you can click the ‘expand’ button on Data acquisition and then hover over ‘Sensors’ to see the units: