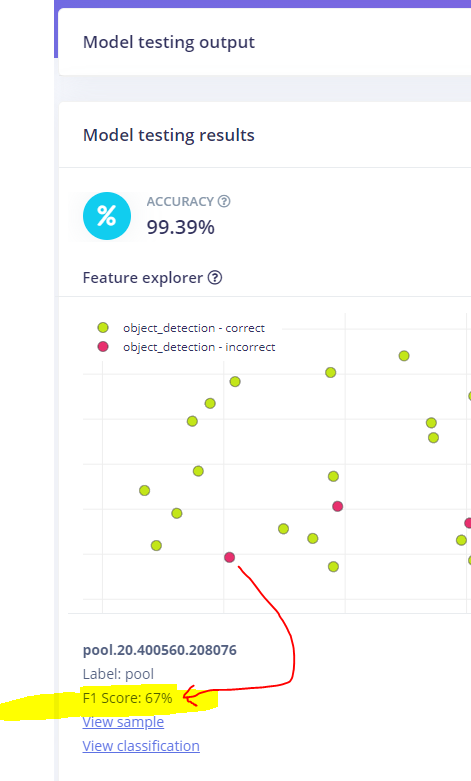
When clicking on a Sample in the chart on the Model Testing page in the Model Testing Results section, an F1 Score is shown. Is it possible to calculate an F1 Score on an individual sample? I thought the F1 Score was based on Precision and Recall that are based on the whole dataset.
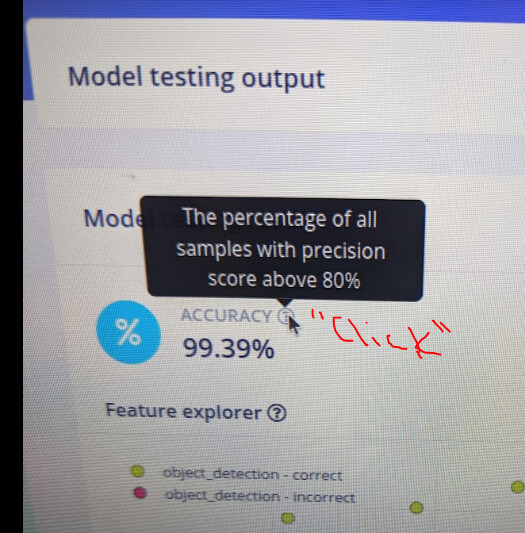
Likewise, when clicking the info icon, a question mark in a circle, near the Accuracy it reads "The percentage of all the samples with a Precision score above 80%". I interpret this as somehow a Precision is being calculated for each Sample. Maybe another way to interpret this is, however unlikely, is that the dataset used to calculate the Accuracy had a Precision greater than 80%. If a Sample was added to the dataset and the Precision dropped below 80% that Sample was thrown out and not used in the Accuracy calculation.
Hi @MMarcial,
I suppose you could calculate an F1 score for a single sample, as that would be the same as having a dataset of 1 sample. That score would not give you a lot of information, though. It would be like calculating the accuracy based on a single test sample (it will end up being 100% or 0%, which is not very useful).
Can you provide a screenshot of where you see that accuracy tooltip? I cannot seem to find it on the Testing page.
I understand your valid argument about a 1 sample dataset but I am questioning how captions are being phrased.
This image seems to declare the individual Sample pool.20.400560.208076 has an F1 Score of 67%.
With regards to the other question I asked…
This image seems to indicate an individual Samples can have a Precision Score > 80%
Hi @MMarcial,
Hmmm…interesting. Could you provide me with your project ID so I could take a look?
Project Id: 136034
The info popup has changed to a statement that makes more sense now.
i9
The Sample info below the chart that appears when you click a Sample in the chart still shows F1 Score that I think should be (Sample) Prediction Accuracy. The table to the left also shows F1 Score.
Hi @MMarcial,
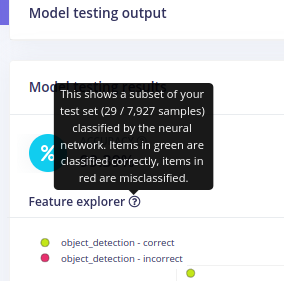
Sorry for the delay on this. I got an answer for you from Dan. It looks like you are using FOMO, and with FOMO, we divide the image into a grid and classify each box, so we can create an F1 score to represent the proportion of correct and incorrect grid boxes.
Hope that helps!