I have deployed the WebAssembly build in my container running Node.js (Node-RED)
Using Node-RED, I am sending every 100 ms an audio fragment of 100 ms to the WebAssembly edge impulse. This is working fine but after some time I am getting error:
"RuntimeError: abort(OOM). Build with -s ASSERTIONS=1 for more info."
Once I get this error, I always get this error (for all future audio fragments).
The only way to fix this is to restart Node-RED container.
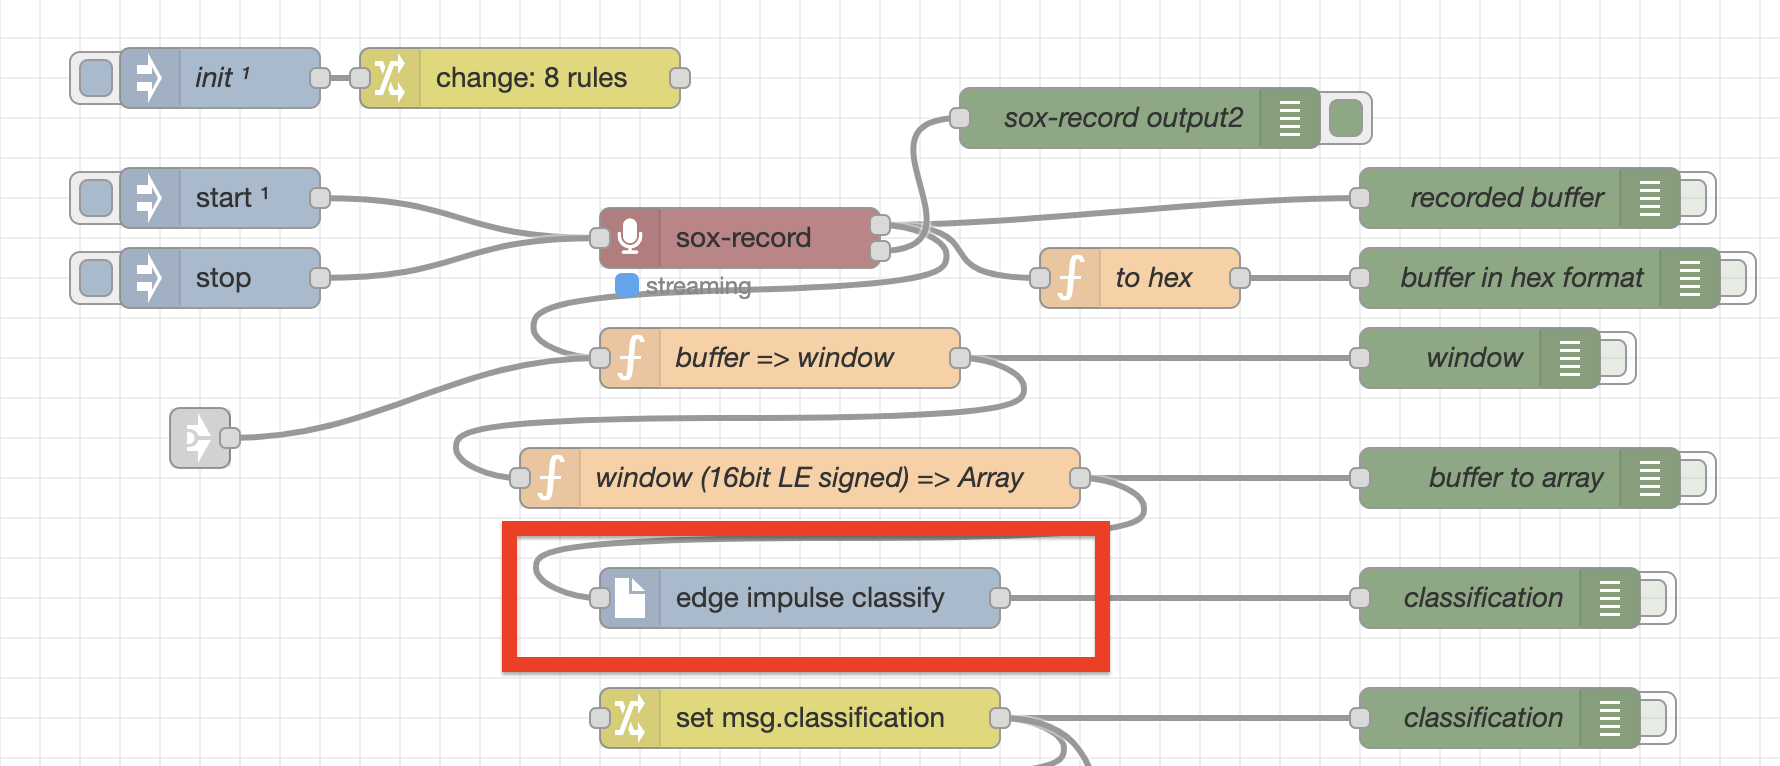
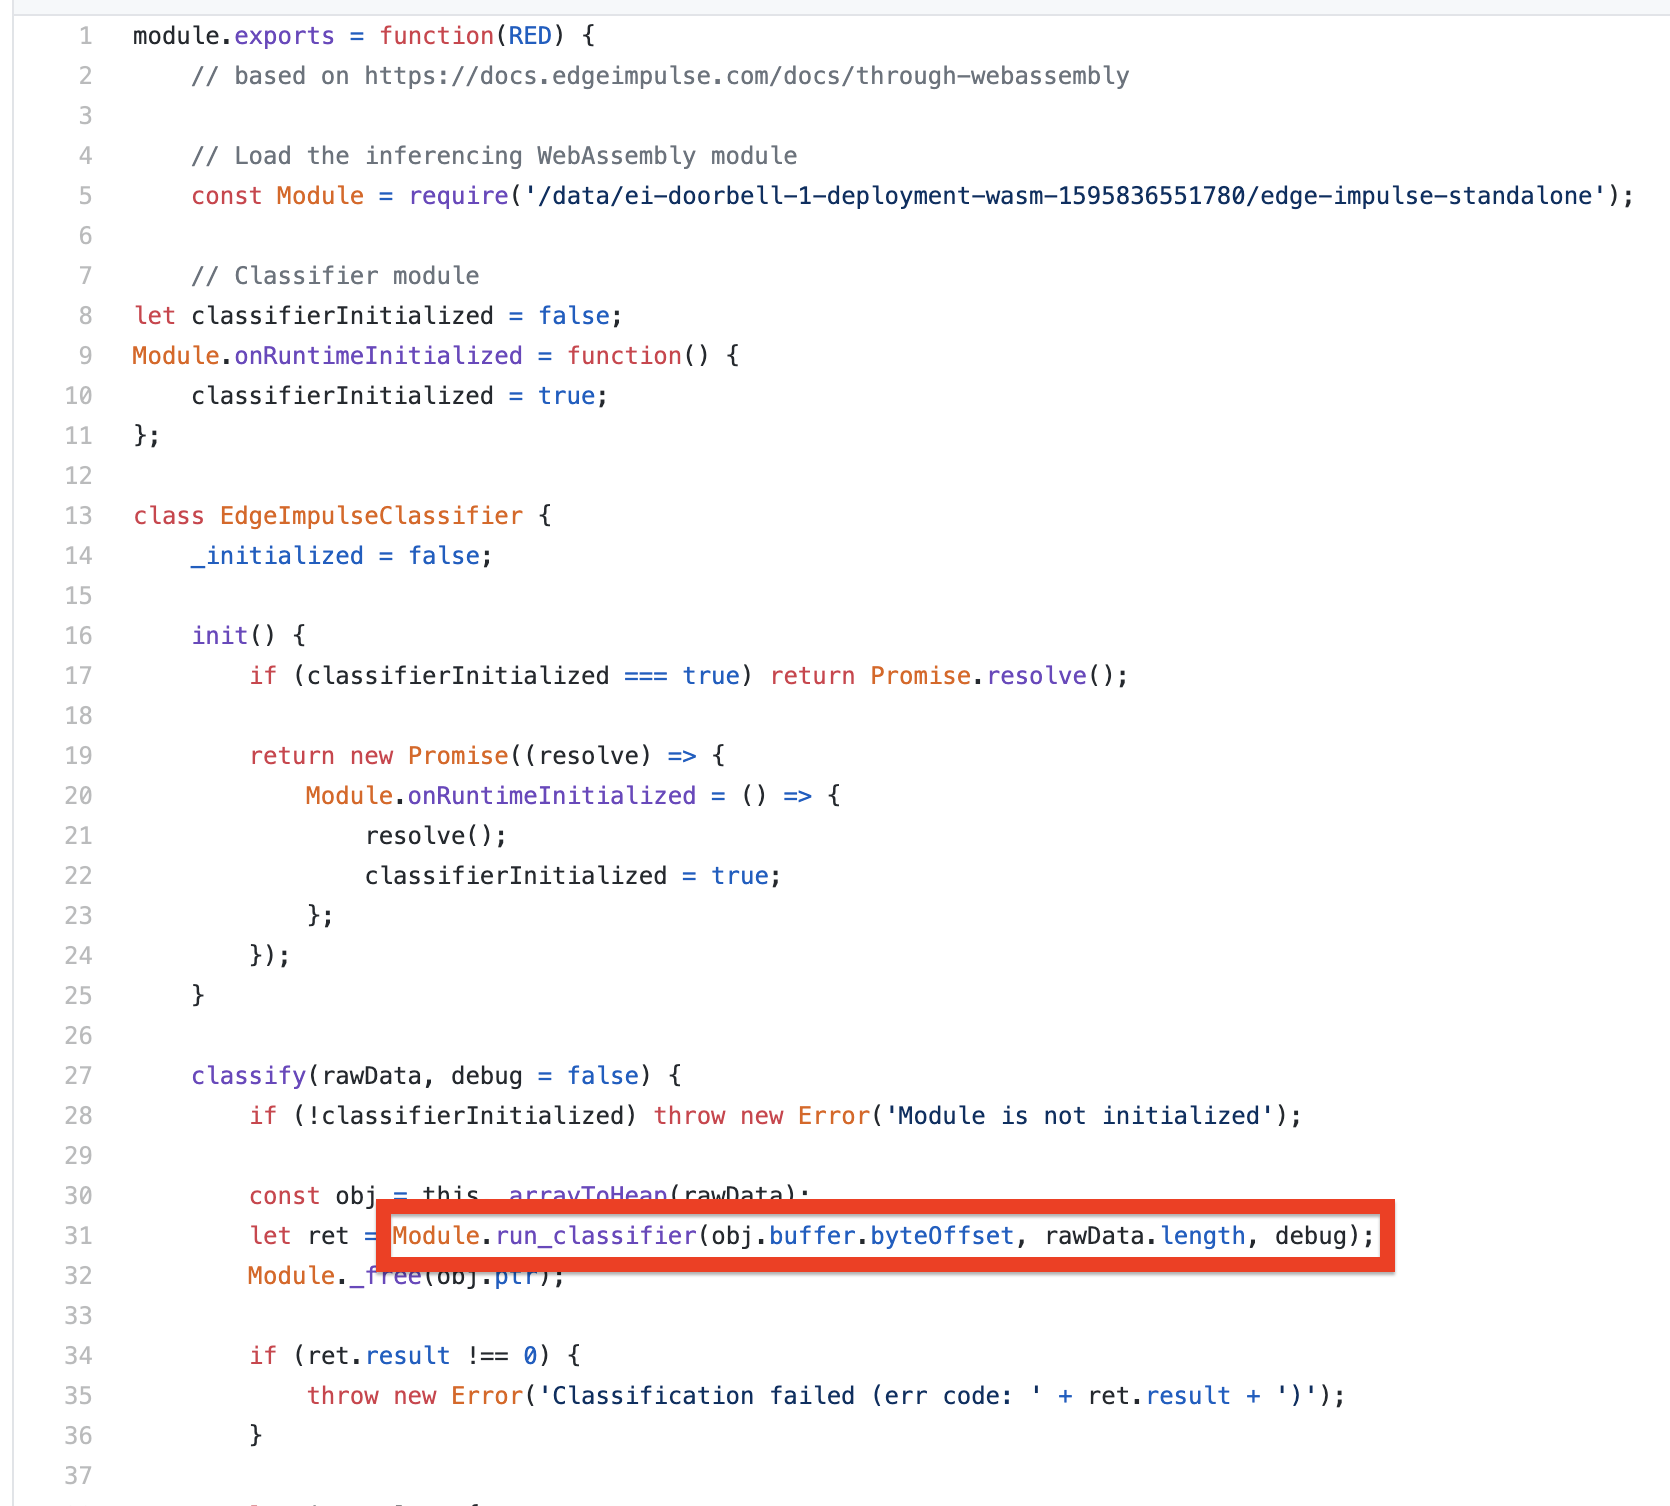
My Node-RED project is using following code to trigger the WebAssembly edge impulse code:
Hi @janvda, interesting case - and it goes deeper than I can currently find. When looking at this with a debugger the JavaScript application seems to run fine, but at some point (for me around inference 16777) something corrupts in the WebAssembly library. I’m going to set a higher memory allocation and allow memory growth there which should hopefully resolve the issue.
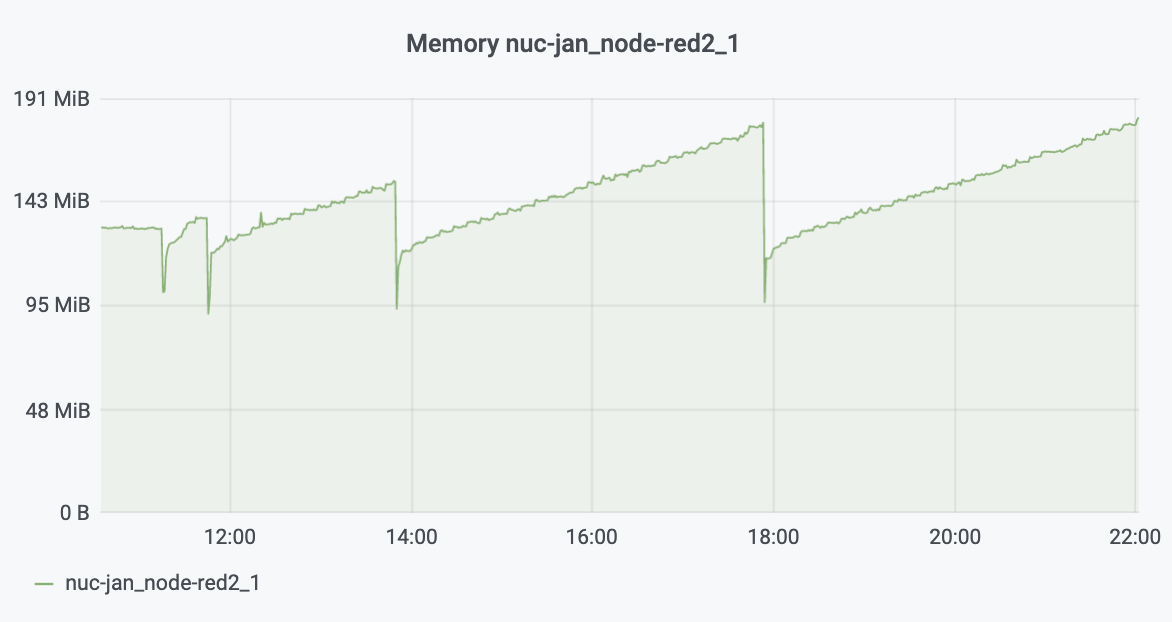
Here some memory stats from my node-red container.
The good news is that I haven’t seen this abort(OOM) error anymore.
The bad news is that there is still some memory leak (this is not necessarily in the deployed edge impulse code).
The memory increased within an hour from 134.5 MB to 149.3MB => around 4000 bytes/sec
I am chopping 44KHz audio (16bit) into chunks of 100ms and pass this on as input to the edge impulse classify node => so the input for this node is 88200 bytes/sec.
So I looked at it last time with the debugger on, and calling the garbage collector manually worked, so I suspect something with the new Uint8Array's that are being created. In your graph it shows that memory eventually is cleaned up though, or is that a restart of the app?
So I am just wondering if the memory leak is not in the webassembly module where each time the classifier method is executed it allocates about 400 bytes without freeing it.
Yeah the underlying library does not leak any memory (we have integration tests for that), but maybe somewhere in the binding. Will do another deep dive next week.
FYI, I have renamed title of this forum topic to make the problem more clear as the initial problem regarding the "RuntimeError: abort(OOM). Build with -s ASSERTIONS=1 for more info." is resolved.
I also created a little github project that is reproducing the problem:
@janvda I’ve been digging through this today, and there’s indeed 332 bytes (depending on the size of your model) leaking in the Emscripten bindings. Internally we use a vector structure for the classifications that Emscripten loses track off when returning to JS context. I’m trying to rewrite this today to get rid of the leak…
edit: we have a fix now, will see if it passes CI and hopefully land early next week.